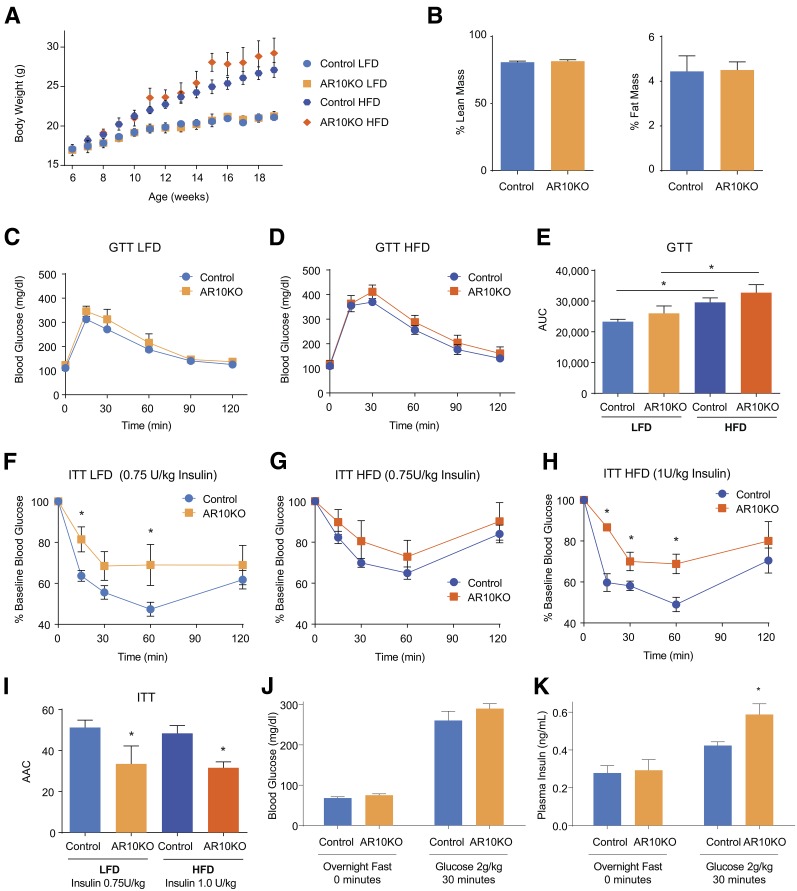
Figure 3.
AR10KO mice are insulin resistant. A: Body weight (ad libitum) of female mice put on LFD or HFD at 6 weeks of age. B: Body composition of chow-fed female mice. n > 5. C and D: GTTs (2 g/kg glucose i.p.) of female mice being fed an LFD (C) or an HFD (D). n > 6. E: Quantification of GTT area under the curve (AUC). F and G: ITT results for female mice being fed an LFD (0.75 units/kg insulin i.p.) (F) or an HFD (0.75–1 unit/kg insuln i.p.) (G and H). n > 6. I: Quantification of ITT area above the curve (AAC). Blood glucose (J) and plasma insulin (K) levels in chow-fed female mice after overnight fasting and 30 min after intraperitoneal glucose injection (2 g/kg). n > 8. *P < 0.05.

