Figure 6.
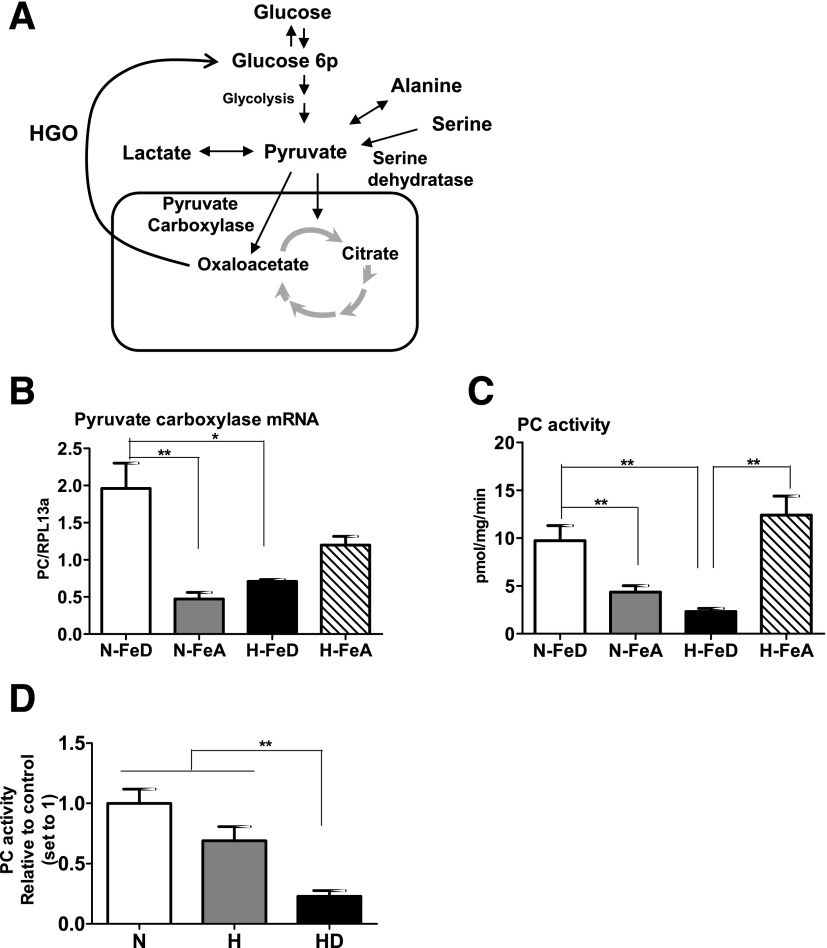
PC activity is significantly lower in hypoxia with iron deficiency. A: Simplified schematic diagram of the fates of pyruvate produced by glycolysis and hepatic gluconeogenesis. B: Relative transcript abundances of PC were analyzed by quantitative RT-PCR and normalized to RPL13a. C: The rates of PC activities were determined in freshly isolated crude mitochondria from mice livers. PC activity was assayed with a [14C]HCO3− fixation assay and expressed as picomoles of oxaloacetate formed per mg protein per min. D: HepG2 cells were exposed to 21% O2 (N), 1% O2 (H), or 1% O2 with 100 μmol/L DFO (HD) for 24 h. Crude mitochondria were freshly isolated from these cells, followed by the incubation with PC activity reaction mixture. Bars represent the mean ± SE of three independent experiments performed in triplicate. HGO, hepatic glucose output. *P < 0.05 and **P < 0.01 indicate the difference among the groups.

