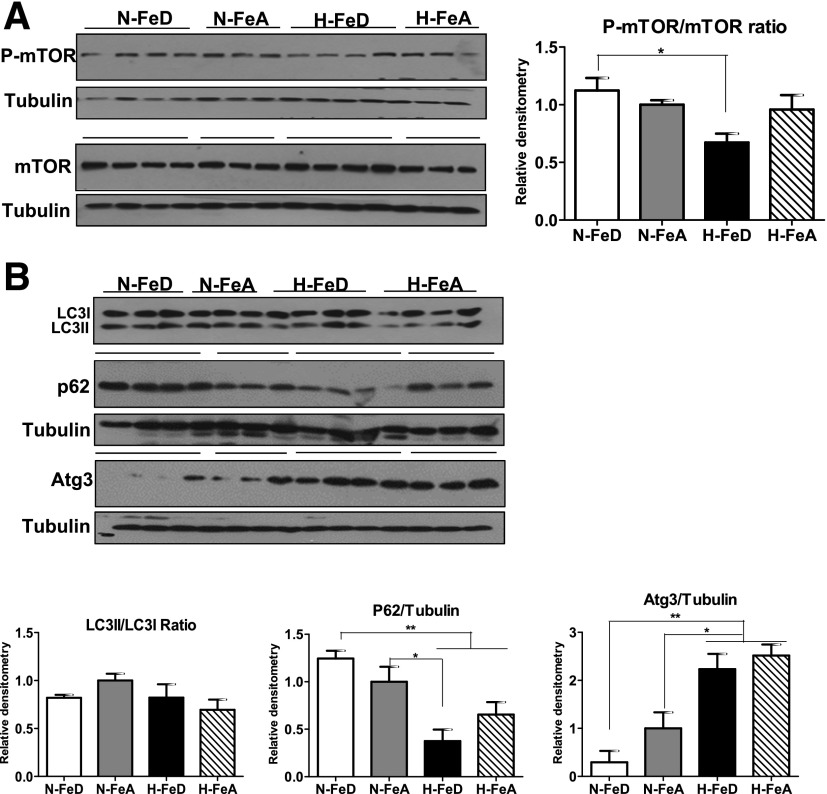
Figure 8.
Decreased mTOR and increased autophagy signaling are observed in hypoxia and iron deficiency in mouse liver. A: Immunoblot analysis of p-mTOR and mTOR in livers of N-FeD, N-FeA, H-FeD, and H-FeA mice. B: Immunoblot analysis of LC3I and LC3II, p62, and Atg3 in mice livers of normoxic or hypoxic mice. The blots were stripped and reprobed with tubulin as a lane loading control. The band intensities were quantified by the ImageJ program. Values are expressed as mean ± SE (n = 4–5 per group). *P < 0.05 and **P < 0.01 indicate the difference among the groups.

