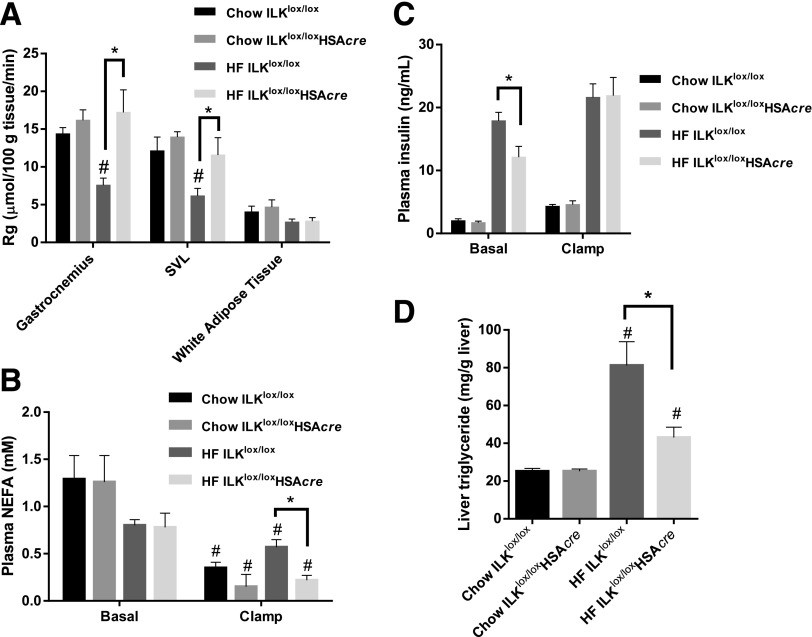
Figure 4.
Muscle glucose uptake, circulating insulin, plasma NEFA, and liver triglyceride. A: Rg was determined by 2-[14C]deoxyglucose (n = 5–9). SVL, superficial vastus lateralis. B: Plasma NEFA was determined at basal (−15 and −5 min) and during the steady state of the ICv (80 and 120 min) (n = 5–9). C: Plasma insulin concentration was measured at basal (−15 and −5 min) and during the steady state of the ICv (100 and 120 min) (n = 5–9). D: Liver triglyceride was determined in liver samples collected at the end of the ICv (n = 5–9). Data are represented as mean ± SEM. #P < 0.05 chow vs. HF with the same genotype. *P < 0.05.

