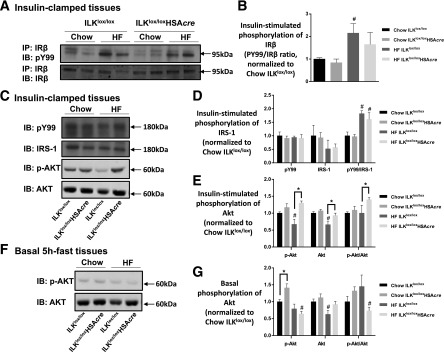
Figure 6.
Insulin signaling in the muscle. Muscle homogenates were prepared from gastrocnemius collected from mice after the hyperinsulinemic-euglycemic clamp (A–E) or from mice after a basal 5-h fast (F and G). A: IR-β was immunoprecipitated (IP), followed by immunoblotting (IB) of PY99 and IR-β. Representative bands are presented (n = 4–6). B: Quantitative data for panel A. C: p-IRS-1 was determined by immunoblotting of PY99 at 180 kDa. Total IRS-1, p-Akt, and total Akt were measured by Western blotting. Representative bands are presented (n = 4–6). D: Quantitative data for the Western blotting of PY99 at 180 kDa and total IRS-1 from panel C. E: Quantitative data for the Western blotting of p-Akt and total Akt from panel C. Data are normalized to chow ILKlox/lox. F: Western blotting of p-Akt and total Akt in basal 5-h–fasted gastrocnemius tissues (n = 4). G: Quantitative data for panel F. Data are represented as mean ± SEM. #P < 0.05 chow vs. HF with the same genotype. *P < 0.05.

