
Figure 4.
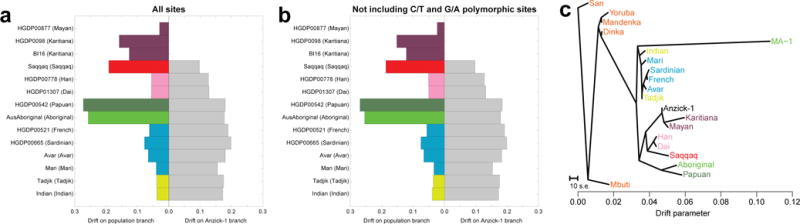
Estimated drift and maximum likelihood tree. Site patterns and drift estimates for non-African populations vs. the Anzick-1 sample. a, Data based on conditioning on African polymorphism, non-African populations in colour on the left, Anzick-1 in grey on the right. b, Data based on conditioning on African polymorphism and removing sites where a C and T or G and A were observed. c, Maximum likelihood tree generated by TreeMix using the whole genome sequencing data with the Mayan genome masked for European ancestry.