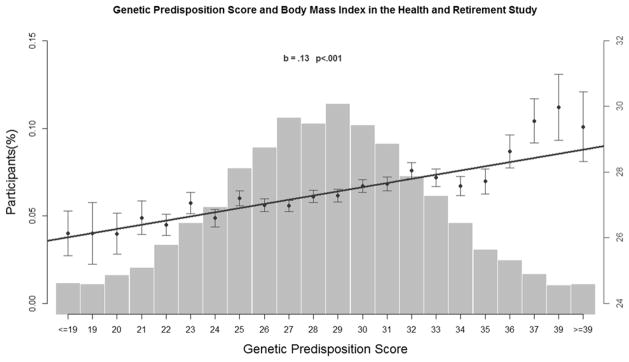
Figure 2.
Genetic Predisposition Score and Body Mass Index in the Health and Retirement Study
Note: GPS is calculated as the number of weighted risk alleles (ranging from 16 to 43) for each participant. The X axis represents GPS and the Y axis on right represents mean BMI (± S.E.) of participants in corresponding GPS category, with the line showing the regression of the mean BMI values on GPS. The histogram (Y axis on left) shows the percentage of participants in each GPS category.

