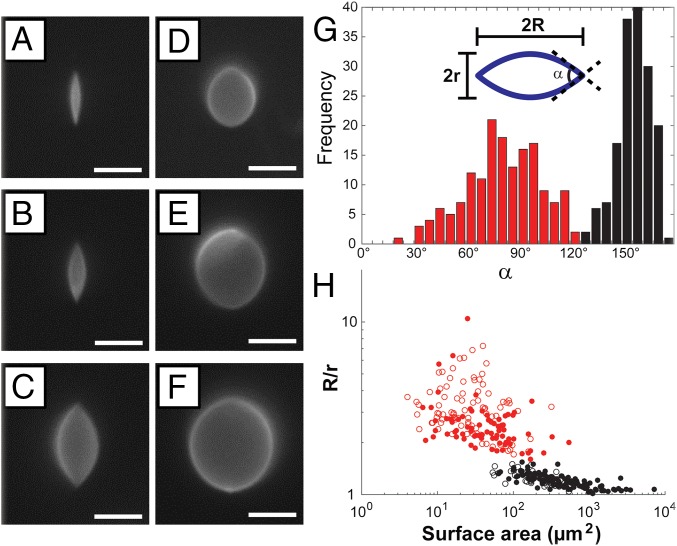
Fig. 2.
Characterization of the two populations of GUVs that formed in nematic DSCG. Fluorescence micrographs of (A–C) highly elongated, cusped GUVs and (D–F) weakly strained GUVs with approximately rounded poles. (G) Histogram depicting the distribution of cusp angles (). (H) GUV aspect ratio (R/r) as a function of GUV surface area. In G and H, data in red and black denote GUVs with 130° and 130°, respectively. In H, filled and open points denote GUVs containing 2 mol % PEG lipid and 0.2 mol % PEG lipid, respectively. (Scale bars: 5 µm.)

