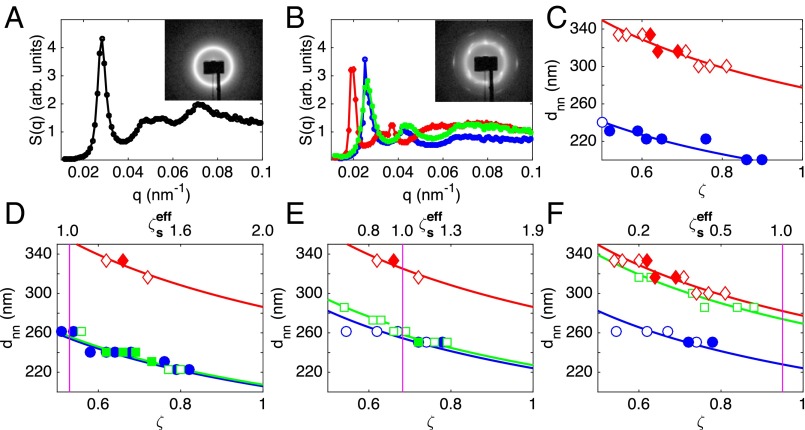
Fig. 1.
(A) Structure factor, , of a glassy suspension with and . (Inset) The detector image. (B) of a bidisperse and the two corresponding monodisperse crystalline samples with (green) and , (blue) , and (red) . (Inset) The detector image of the bidisperse sample. (C−F) Nearest neighbor distance, , versus generalized volume fraction, ζ, for (blue circles) small-only, (red diamonds) large-only, and (green squares) bidisperse suspensions with (D) , (E) , and (F) . Crystalline samples are represented by filled symbols. The lines are fits to , with a as a fitting parameter. In D−F, is given by the upper x axis, and the violet vertical line indicates a value of . The swollen radii of the particles used in all shown measurements are listed in Table S1.

