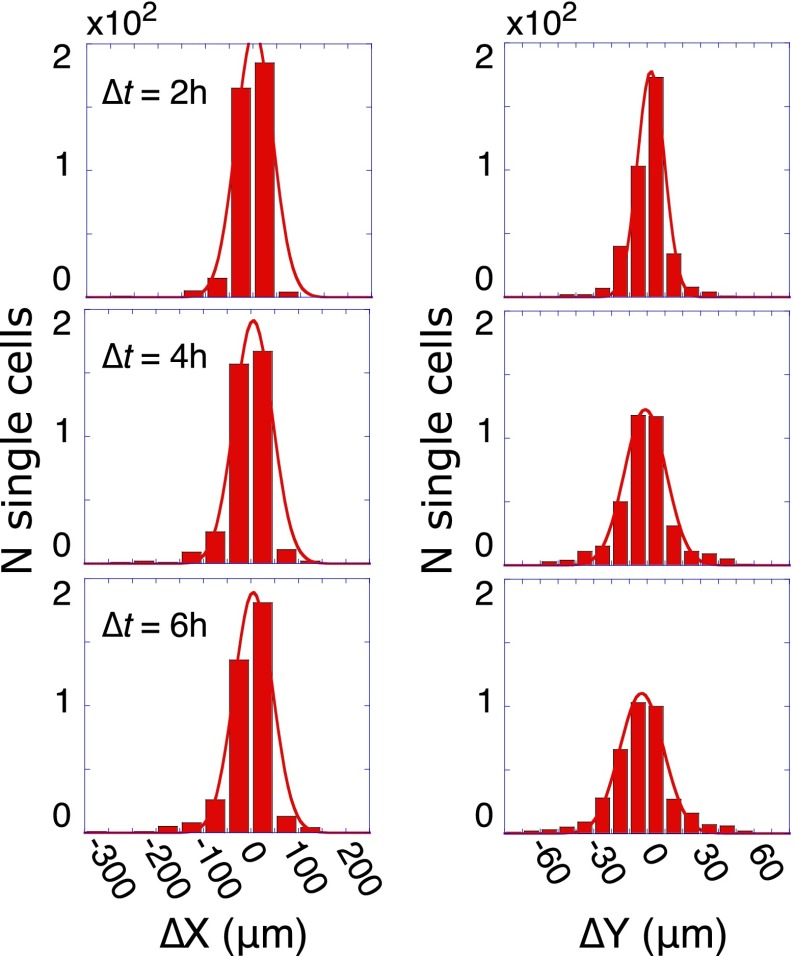
Fig. 5.
Brownian-like motion of isolated cells. Displacements of noninteracting single cells in the X (left column) and Y directions, observed after time delays of ∆t = 2, 4, and 6 h for about 400 isolated single cells. Displacements were binned into histograms and fitted to Gaussian distributions (R2 > 0.97 for all histograms). Because the microchamber is rectangular, the displacements along X and Y do not span the same range. The diffusion coefficient D was determined from the fits using the Einstein–Smoluchowski equation for the width of the histogram in a given direction, .

