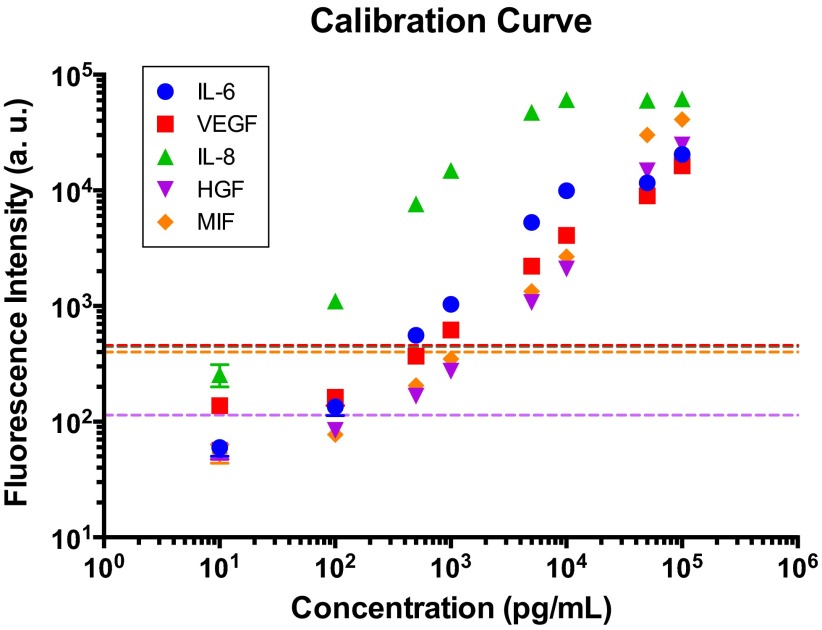
Fig. S3.
Quantitation of fluorescence intensity vs. concentration for all five proteins. Mixtures of standard proteins with eight predefined concentrations were introduced to eight microchannels of the SCBC device, respectively. The averaged levels of fluorescence intensity for two-cell chambers are indicated as dotted lines. Different line colors represent specific proteins according to the colors in the legend. Fluorescence signal levels from two cells lie on the linear region of the calibration curve. Error bars indicate SD.

