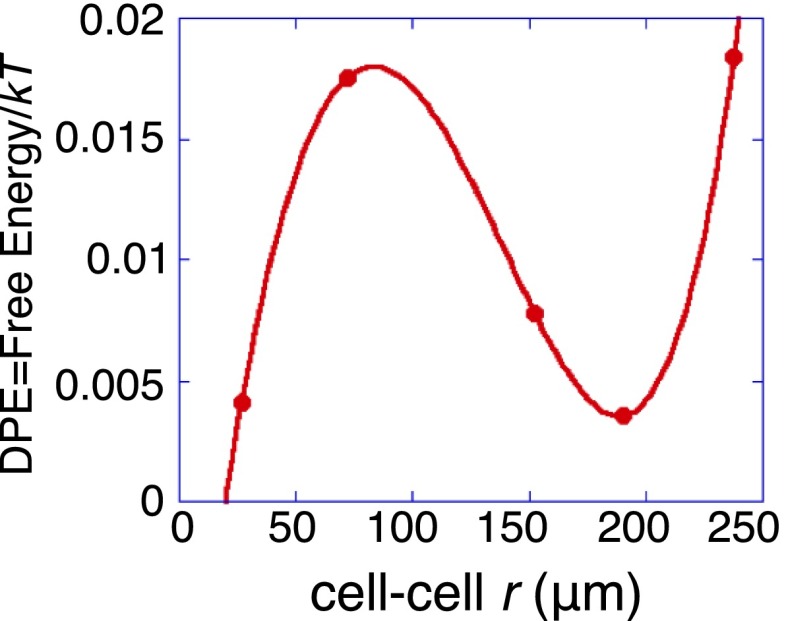
Fig. S6.
Free energy as a function of cell–cell separation (in units of the thermal energy kT, per protein). The DPE function was calculated using the experimental levels of the secreted proteins, and the calculated protein levels at the steady state . Dots: experimental results computed as described in Surprisal Analysis, Free Energy as a Function of Cell–Cell Separation. Curve: a polynomial fit showing the harmonic potential about the minimum at 200 μm and the low value at very short distances, likely reflecting cell–cell adhesion.

