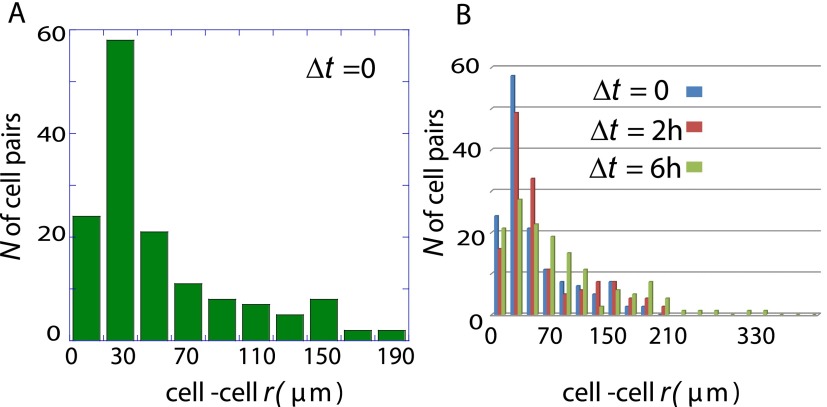
Fig. S7.
Distribution of cell–cell separations immediately after acclimation and after an additional delay of 2 and 6 h. (A) Experimental results for the distribution of cell–cell separations at the earliest time point, acclimation (2 h after the cell loading to the chip, Δt = 0 h). The cell–cell separations observed after acclimation were binned into histograms for the cell pairs initially separated by <200 μm. (B) Experimental results for the distribution of cell–cell separations at the earliest time point as shown in A and after Δt = 2 and 6 h are shown. The cell–cell separations were binned into histograms for the cell pairs initially separated by <200 μm. The cells that are separated by less than about 50 μm do not move by much toward the steady-state separation of .

