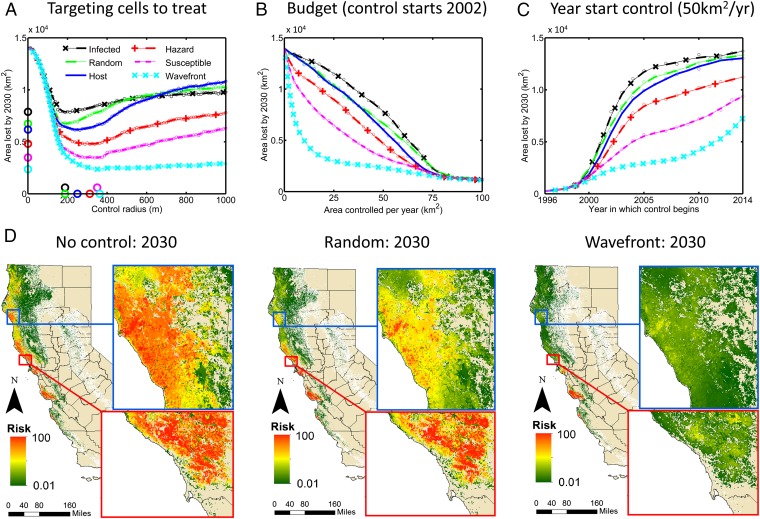
Fig. 5.
Optimizing the set of locations to treat. (A) The median area lost by 2030 as a function of treatment radius, comparing strategies to prioritize disease foci for treatment. Management starts in 2002, with sufficient budget to treat 50 km2/y. Circles show the optimal radius and minimum median area lost for each strategy. (B) Response of area lost to the budget, independently optimizing the radius for each strategy at each budget. In all cases, control starts in 2002. (C) The area lost by 2030 as a function of the year in which treatment starts, for treatment of up to 50 km2/y, again optimizing the radius of treatment for each strategy for each year. (D) Maps showing the risk of infection in 2030 with no control (Left), treating with random selection of sites from the set of sites known to contain untreated infected (Middle), and for control, focusing treatment at and beyond the northward moving wave front of the epidemic (Right). Both treatment strategies are shown at their optimal radius, for treatment starting in 2002 and with sufficient budget to treat 50 km2/y.

