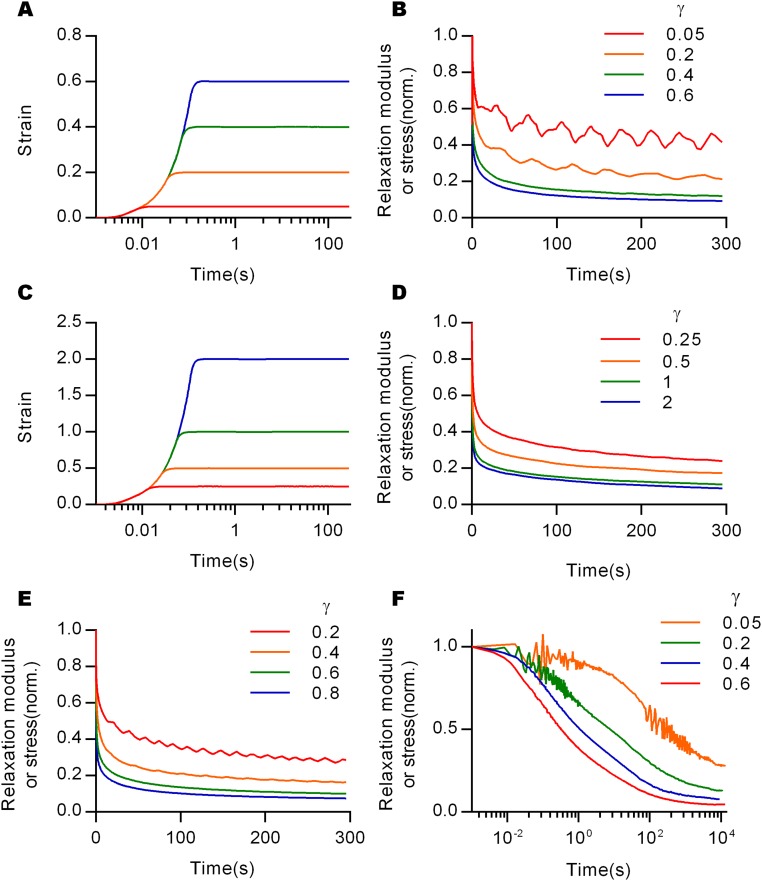
Fig. S1.
Stress relaxation tests with various conditions. The profiles of strains of stress relaxation test with constant strain rate and the corresponding results of stress relaxation with normalization (A and B) for collagen (5/s), and (C and D) for fibrin (16/s). (E) Stress relaxation tests with different strains were conducted for a collagen gel with a collagen concentration of 2.7 mg/mL. (F) Stress relaxation tests of collagen gels for the indicated strains at long timescales.

