Fig. 5.
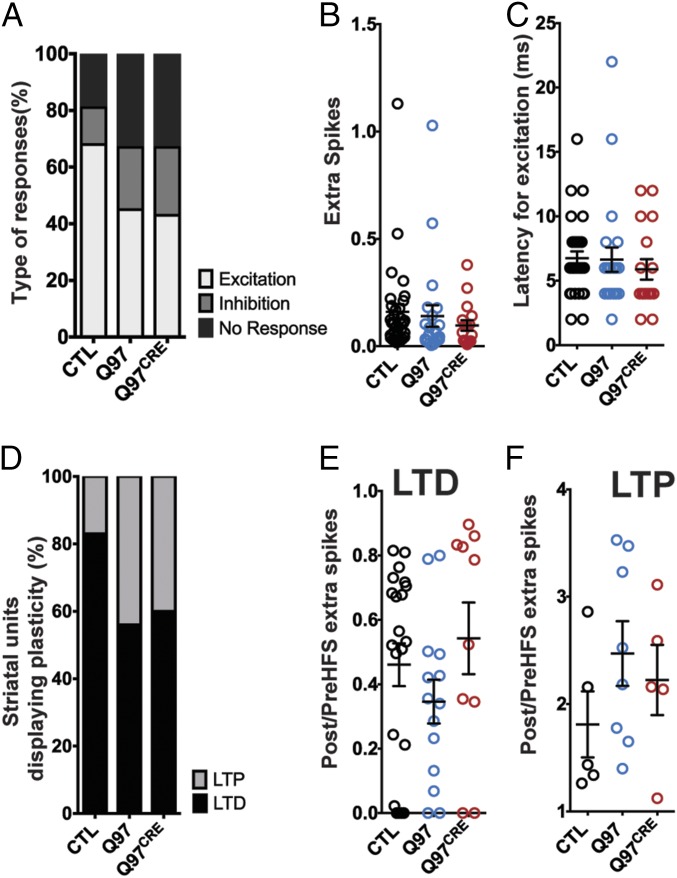
Q97CRE mice display impairments in corticostriatal connectivity and plasticity. (A) Proportion of cells exhibiting an excitatory response to cortical stimulation was reduced in both Q97 and Q97CRE mice in comparison to CTL mice (CTL = 47, Q97 = 49, and Q97CRE = 47 cells). (B) Correspondence to the summary data for the number of extra spikes elicited in striatal units displaying excitation by cortical stimulation (CTL = 32, Q97 = 22, and Q97CRE = 17 cells). The number of extra spikes was similar among all experimental groups. (C) Correspondence to the summary data for latency to elicited excitation in striatal units by cortical stimulation. The latency was similar among all experimental groups. (D) Proportion of striatal cells undergoing LTP is increased in both Q97 and Q97CRE mice in comparison to CTL mice (CTL = 27, Q97 = 22, and Q97CRE = 15 cells). (E and F) Summary data for striatal units undergoing LTD or LTP, respectively, for all experimental groups. (E) Ratio of spikes before and after HFS for cells undergoing LTD was not statistically different among genotypes. (F) Ratio of spikes before and after HFS for cells undergoing LTP among all experimental groups was not statistically different among genotypes. We used six to eight mice per genotype in all of the experimental paradigms. The mean and SEM are displayed in B, C, E, and F, and each individual point represents a striatal unit.

