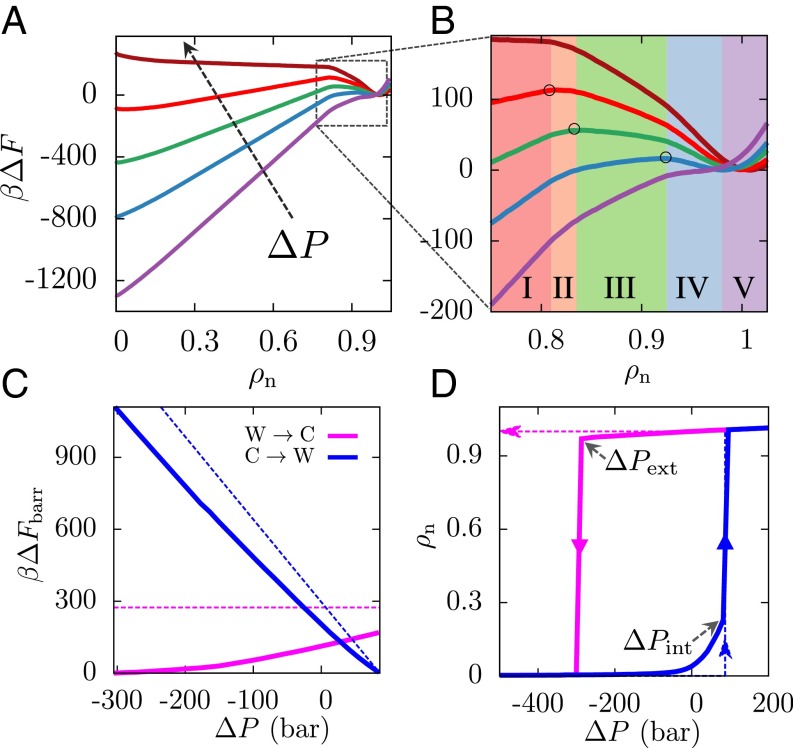
Fig. 3.
Effect of pressure on Cassie–Wenzel transitions. (A) is shown for pressures ranging from −350 to 100 bar, with the arrow pointing in the direction of increasing pressure (purple, −350 bar; blue, −200 bar; green, −100 bar; red, 0 bar; brown, 100 bar). As pressure is increased, the slope of the classical region I decreases, destabilizing the Cassie state; conversely, as pressure is decreased, the Wenzel state is destabilized. (B) This destabilization of the Wenzel state is manifested not only in an increase in the slope of region I but also in a corresponding increase in the slopes of the nonclassical regions II–IV, from negative toward zero to eventually being positive. As a result, a decrease in pressure shifts the location of the barrier (○) to higher and leads to a concomitant decrease in the height of the barrier. (C) The barriers for the wetting and dewetting transitions are shown here as a function of (simulation, solid lines; theory, dashed lines). Both the simulated and the classical Cassie-to-Wenzel barriers (blue) decrease on increasing pressure, eventually disappearing at the intrusion pressure, . On the other hand, although the classical Wenzel-to-Cassie barrier (magenta) is predicted to be independent of pressure, simulations suggest that the barrier to dewetting disappears at a sufficiently small extrusion pressure, . (D) Pressure-dependent hysteresis curves for , assuming the system remains in its metastable basin and is unable to surmount barriers larger than 1 .

