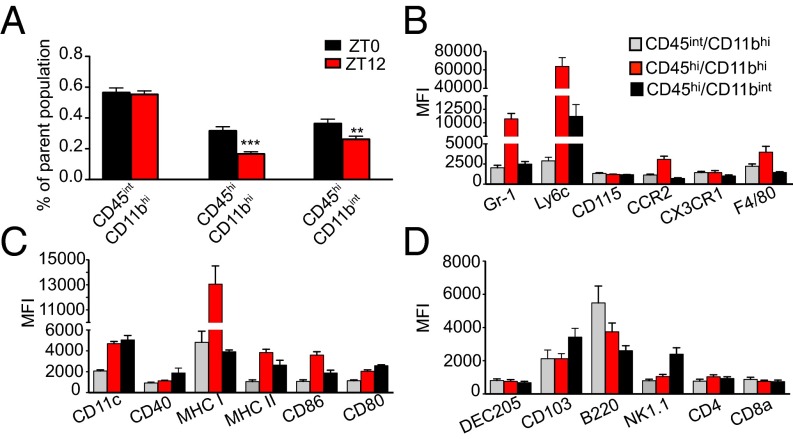
Fig. 3.
Circadian time of infection affects immune cell populations in the OB of VSV-infected mice. Mice were killed at 96 h following VSV, and OB tissue was processed for flow cytometry analysis. (A) Cells pregated on live/singlets/lin− were analyzed based on the expression of CD45 and CD11b. Three distinct populations were detected: CD45int/CD11bhi, CD45hi/CD11bhi, and CD45hi/CD11bint. Compiled data are expressed as mean ± SEM of the percent of parent population (n = 50 for each population; Student’s t test, **P < 0.01, ***P < 0.001, ZT12 vs. ZT0). (B–D) CD45/CD11b cell populations were phenotyped using flow cytometry. Only data for ZT0 group are shown because no phenotypic differences were found between the ZT0 and ZT12 groups. Data compiled from two or three independent experiments are expressed as mean ± SEM of geometric mean of fluorescence intensity (MFI) for each antibody (total n = 4–6 per group.)

