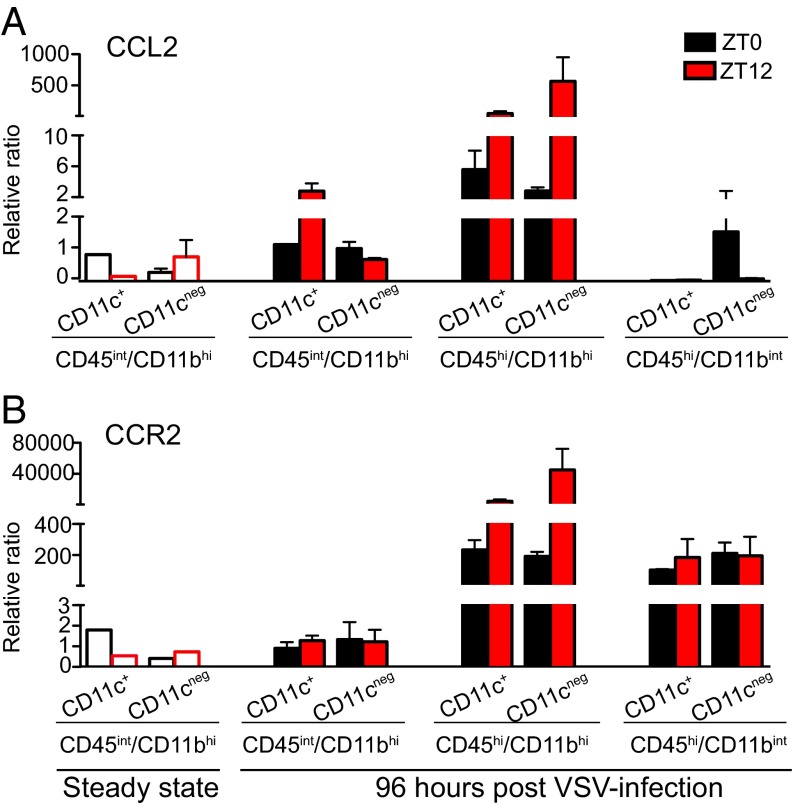
Fig. 7.
CCL2 and CCR2 expression in OB immune cells. (A and B) CD45int/CD11bhi, CD45hi/CD11bhi, and CD45hi/CD11bint cells isolated from the OB of VSV-infected mice at 96 hpi were FACS sorted based on CD11c expression. The only population present in the OB of untreated mice, CD45int/CD11bhi, was analyzed also (steady state, open bars). Total RNA was isolated, and transcript levels for CCL2 (A) and CCR2 (B) were measured by qPCR. Data compiled from five independent experiments are expressed as mean ± SEM (total n = 5).

