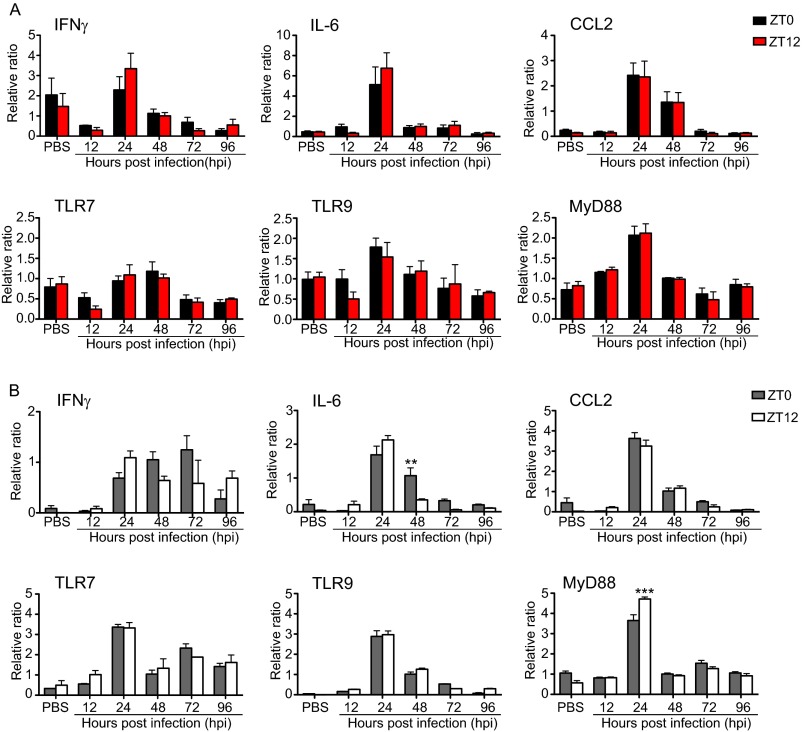
Fig. S2.
Time course of gene expression in the spleen (A) and lung (B) of VSV-infected mice. Tissue was collected from PBS-treated and VSV-infected mice at the indicated time points. Total RNA was isolated, and transcript levels were measured by qPCR using Taqman gene-expression assays. Data are expressed as mean ± SEM (n = 6–8 per time point; two-way ANOVA followed by Bonferroni's multiple comparison test, **P < 0.01, ***P < 0.001, ZT0 vs. ZT12).

