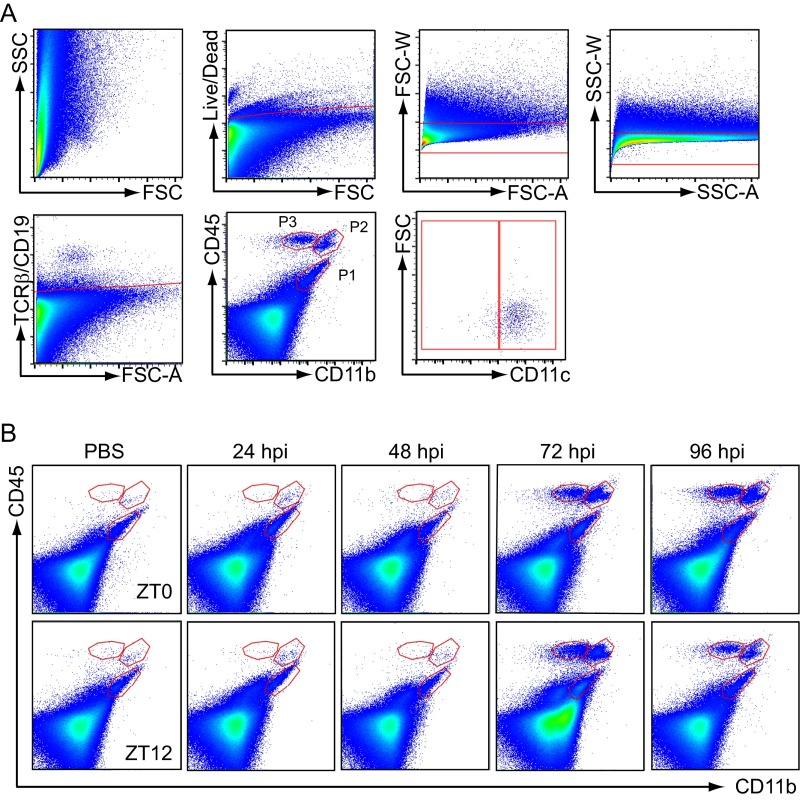
Fig. S3.
Immune cell analysis in VSV-infected mouse OB tissue by flow cytometry. (A) Gating strategy used for FACS and flow cytometry experiments: Cells were gated on live/dead, forward-scatter (FSC) singlets, side-scatter (SSC) singlets, TCRβ/CD19-negative, CD45/CD11b cells. Three cell populations distinguished based on CD45 and CD11b expression (P1, CD45int/CD11bhi; P2, CD45hi/CD11bhi; and P3, CD45hi/CD11bint) were each gated further on CD11c cells. (B) Three cell populations (P1, CD45int/CD11bhi; P2, CD45hi/CD11bhi; and P3, CD45hi/CD11bint) were analyzed by flow cytometry 24–96 hpi in control (PBS-treated) and VSV-infected mouse OB.

