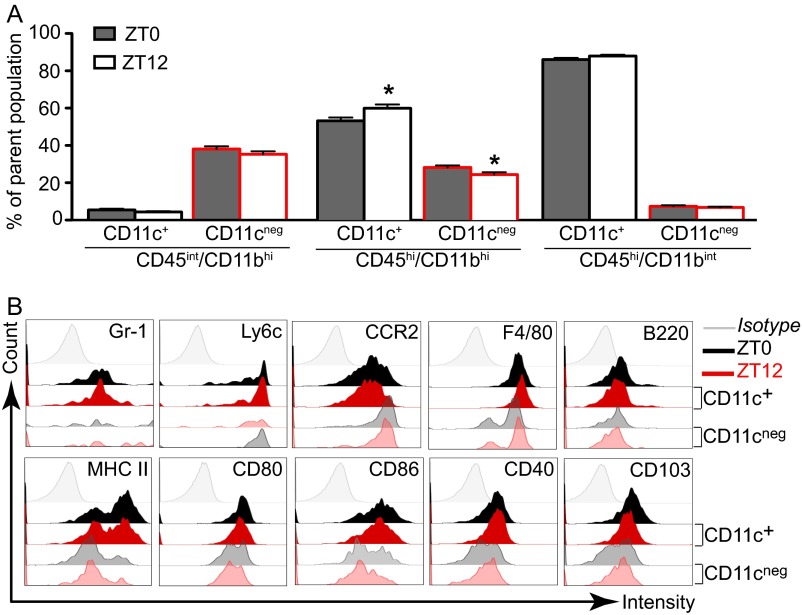
Fig. S4.
Analysis of CD11c+ and CD11c− subpopulations in the OB tissue. Mice were killed 96 h following VSV infection, and OB tissue was processed for flow cytometry analysis. Cells pregated on live/singlets/lin− were analyzed based on the expression of CD45/CD11b. (A) The proportion CD11c+ and CD11c− subsets was determined within three immune cell populations. Data are expressed as mean ± SEM of the percent of the parent population (total n = 50 for each population; Student’s t test, *P < 0.05, ZT0 vs. ZT12). (B) The phenotype of CD11c+ and CD11c− cells was characterized further using a variety of markers characteristic of monocytes and other immunological subsets. Representative histograms for cells isolated from ZT0 and ZT12 mice OB are shown.

