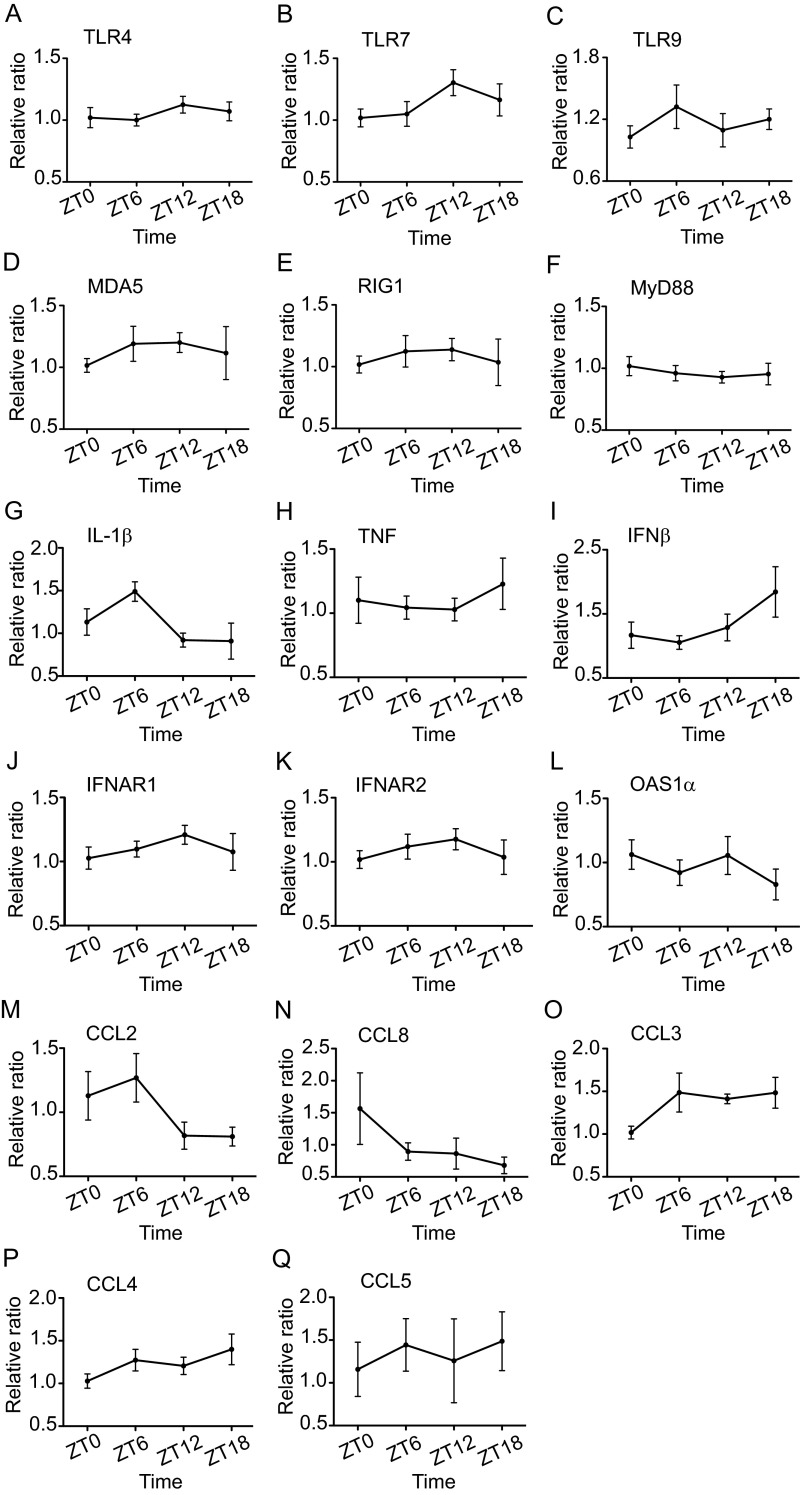
Fig. S6.
Expression of immune genes in the OB tissue of naive mice. Total RNA was isolated from OB tissue at the indicated time points. Transcript levels for pattern-recognition receptors (A–F), proinflammatory cytokines (G and H), antiviral cytokine and receptors (I–L), and chemokines (M–Q) were measured by qPCR using Taqman gene-expression assays. Data are expressed as mean ± SEM and represent a composite of three independent experiments (total n = 6 per time point).

