Fig. 1.
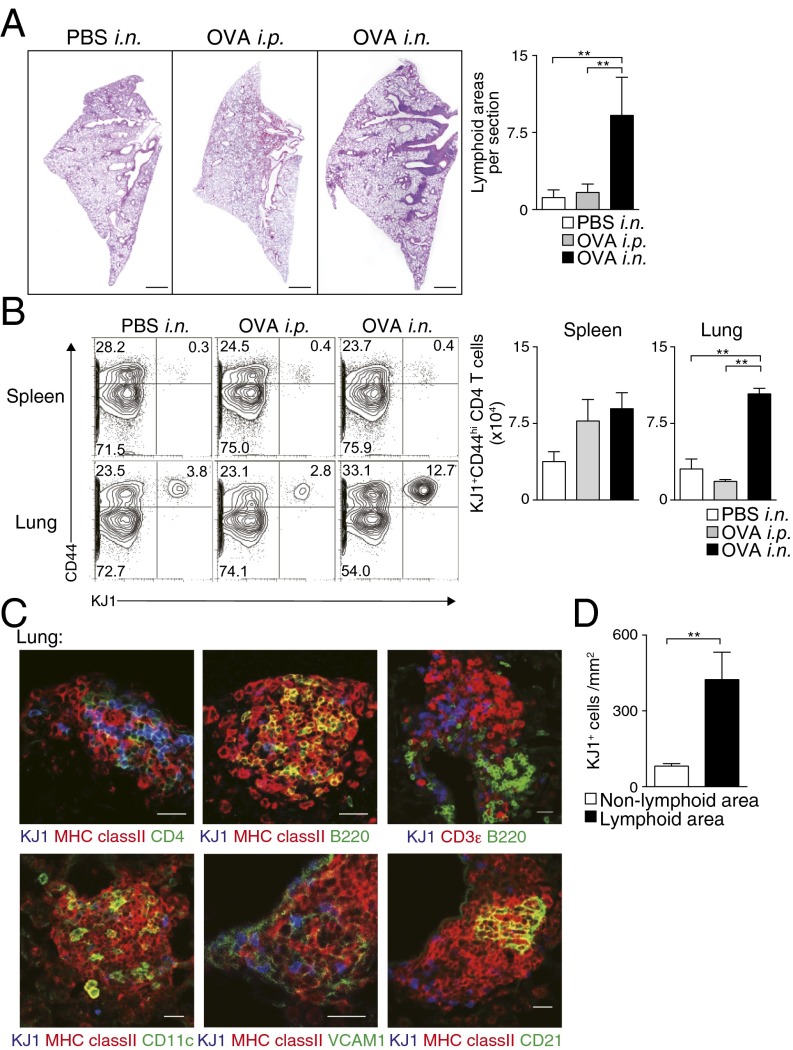
Memory Th2 cells preferentially localized in iBALT. Effector Th2 cells from DO11.10 OVA-specific αβTCR Tg mice were transferred i.v. into BALB/c mice, which were subsequently challenged i.n. with OVA or PBS solution (control) or i.p. with OVA (control) at days 1 and 3, and the indicated assays were performed at day 42. (A) Representative cryosections of the lungs stained with H&E are depicted (Left), as is the absolute number of iBALT structures in the lungs (Right). (Scale bars, 1 mm.) Mean values with SD from at least three mice per group are shown. Two independent experiments were performed with similar results. (B) Representative staining profiles of CD44 and KJ1 expression on CD4+ cells from the indicated organs (Left) and absolute cell numbers of KJ1+CD44hiCD4+ T cells in the indicated organs (Right). Mean values with SD from five mice per group are shown. More than five independent experiments were performed with similar results. (C) Representative confocal micrograph of lung tissue stained with anti-KJ1 (blue), anti-MHC class II (red), and anti-CD4 (green) (Upper Left); anti-KJ1 (blue), anti-MHC class II (red), and anti-B220 (green) (Upper Middle); anti-KJ1 (blue), anti-CD3ε (red), and anti-B220 (green) (Upper Right); anti-KJ1 (blue), anti-MHC class II (red), and anti-CD11c (green) (Lower Left); anti-KJ1 (blue), anti-MHC class II (Red), and anti-VCAM1 (green) (Lower Middle); or anti-KJ1 (blue), anti-MHC class II (Red), and anti-CD21 (green) (Lower Right) are shown. (Scale bars, 40 μm.) More than three independent experiments were performed with similar results. (D) Morphometric analysis of KJ1+ cells localized in lymphoid areas of the lungs is shown. Means and SD calculated from analysis of three slides per mouse from four mice. Two independent experiments were performed with similar results (**P < 0.01).

