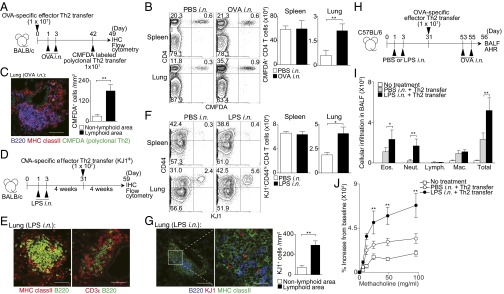
Fig. 3.
Antigen-independent maintenance of memory Th2 cells in iBALT. (A) Splenic CD4+ T cells from WT mice were cultured under Th2 conditions. These polyclonal Th2 cells were labeled with CMFDA and transferred into the mice 42 d after induction of iBALT as described in Fig. 1, and analyzed 1 wk later at day 49. (B) Representative staining profiles of CD4 and CMFDA in the indicated organs are shown. (C) Representative confocal micrographs of lung tissue from mice in A stained with anti-B220 (blue), anti-MHC class II (red), and CMFDA (green) (Left), and morphometric analysis of CMFDA+ cells localized in lymphoid areas of the lungs (Right). (Scale bars, 100 μm.) (D) BALB/c mice were administered i.n. with LPS at days 1 and 3, and effector Th2 cells from DO11.10 OVA-specific αβTCR Tg mice were transferred i.v. at day 31, with analysis performed at day 59. (E) Representative confocal micrograph of lung tissue from mice in D stained with anti-MHC class II (red) and anti-B220 (green) (Left), and anti-CD3ε (red) and anti-B220 (green) (Right). (Scale bars, 40 μm.) (F) Representative staining profiles of CD44 and KJ1 expression on CD4+ cells in the indicated organs. (G) Representative confocal micrograph of lung tissue from mice in D stained with anti-B220 (blue), anti-KJ1 (red), and anti-MHC class II (green) (Left and Middle), and morphometric analysis of KJ1+ cells localized in lymphoid areas of the lungs (Right). (Scale bars: Left, 100 μm; Middle, 20 μm.) (H) C57BL/6 mice were administered i.n. with LPS on days 1 and 3, and effector Th2 cells from OT-II Tg mice were transferred i.v. at day 31. Mice were challenged i.n. with OVA on days 53 and 55, and BAL fluid and airway hyperresponsiveness were assessed on day 56. (I) Absolute cell numbers of eosinophils (Eos.), neutrophils (Neut.), lymphocytes (Lymph.), and macrophages (Mac.) in the BAL fluid are shown. (J) Airway hyperresponsiveness was assessed by measuring methacholine-induced changes in lung resistance. Mean values from four (B, C, and E–G) or five (I and J) mice per group are shown with SD or SEM. Two independent experiments were performed with similar results (A–J) (**P < 0.01; and *P < 0.05).

