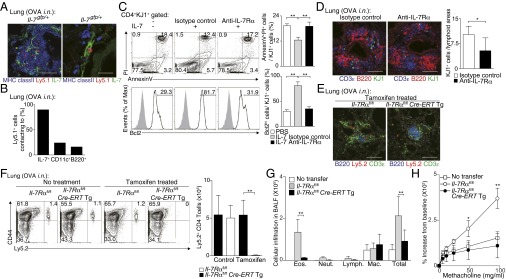
Fig. 4.
IL-7 controls persistence of iBALT-residing memory Th2 cells. (A) Effector Th2 cells from Ly5.1 × OT-II Tg mice were transferred into IL-7:GFP knock-in mice (Il-7gfp/+). Mice were challenged i.n. with OVA on days 1 and 3 and assessed on day 42. Representative confocal micrograph of lung tissue stained with anti-GFP:IL-7 (green), anti-MHC class II (blue), and anti-Ly5.1 (red) are shown. (Scale bars: Left, 100 μm; Right, 20 μm.) (B) Quantification analysis of memory Th2 cells (Ly5.1+) proximal to IL-7+, CD11c+, or B220+ cells in the host lung is shown. (C) Representative FACS plots of Annexin V and PI staining (Upper) and Bcl2 expression (open histogram) (Lower) by KJ1+CD4+ cells are shown. Percentages of Annexin V+PI+ cells (Upper Right) and Bcl2hi cells (Lower Right) in the KJ1+CD4+ population are shown. (D) IL-7Rα–specific antibody or isotype control antibody was administered i.n. every second day, starting from day 42 after Th2 cell transfer, and mice were assessed at day 49. Representative confocal micrograph of iBALT in the lung tissue from mice treated with anti–IL-7Rα antibody and stained with anti-B220 (red), anti-CD3ε (blue), and anti-KJ1 (green) are shown (Left). Quantification analysis of KJ1+ cells localized in lymphoid areas of the lungs is shown (Right). (Scale bars, 100 μm.) (E–H) Effector Th2 cells from Ly5.2 Il-7Rαfl/fl × OT-II Tg (Il-7Rαfl/fl) mice or Ly5.2 Il-7Rαfl/fl × Cre-ERT Tg × OT-II Tg (Il-7Rαfl/flCre-ERTTg) mice were transferred into Ly5.1 mice. Mice were challenged i.n. with OVA on days 1 and 3 and assessed on day 42. Tamoxifen was injected i.p. on days 42–46 and 49–53, and mice were analyzed on day 56 (E and F) or challenged i.n. with OVA on days 56 and 58, and BAL fluid and airway hyperresponsiveness were assessed on day 59 (G and H). (E) Representative confocal micrographs of lung tissue stained with anti-B220 (blue), anti-CD3ε (green), and anti-Ly5.2 (red) are shown. (Scale bars, 100 μm.) (F) Representative staining profiles of Ly5.2 and CD44 expression on CD4+ cells are shown (Left) with absolute cell numbers of memory Th2 cells (Ly5.2+) in the lungs (Right). (G) Absolute cell numbers of eosinophils (Eos.), neutrophils (Neut.), lymphocytes (Lymph.), and macrophages (Mac.) in the BAL fluid are shown. (H) Airway hyperresponsiveness was assessed by measuring methacholine-induced changes in lung resistance. The mean values from five (A, B, E, and F), four (G and H), or three (D) mice per group or technical triplicates (C) are shown with SD or SEM. More than two independent experiments were performed with similar results (A–F; **P < 0.01; and *P < 0.05).

