Fig. 5.
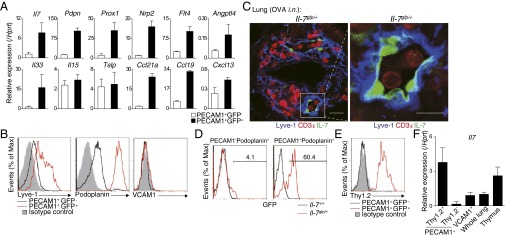
Identification and characterization of IL-7–producing LECs localized in iBALT. (A–D) Effector Th2 cells from Ly5.1 OT-II Tg mice were transferred into IL-7:GFP knock-in mice (Il-7gfp/+). Mice were challenged i.n. with OVA on days 1 and 3. The indicated assays were performed at day 42. (A) GFP+ cells or GFP− cells among PECAM1+ cells (a mix of lymphatic and BECs) were sorted from the lung of mice. Quantitative RT-PCR analysis of expression of the indicated genes was performed. (B) Representative cell surface staining profiles of PECAM1+GFP− (black lines) and PECAM1+GFP+ cells (red lines) are shown; gray-shaded curves show staining with isotype-matched control antibody. (C) Representative confocal micrograph of lung tissue from Il-7gfp/+ mice stained with anti-GFP:IL-7 (green), anti-CD3ε (red), and anti–Lyve-1 (blue). Lyve-1 expression within iBALT can be observed on the vessel-like structures and reticular cells. (Scale bars: Left, 20 μm; Right, 10 μm.) (D) Representative GFP expression profiles of PECAM1−Podoplanin+ cells and PECAM1+Podoplanin+ cells from the lung of Il-7+/+ (black line) or Il-7gfp/+ (red line) mice, gated by the strategy as described in Fig. S5D. (E) Representative cell surface staining profiles of Thy1.2 expression on PECAM1+GFP− cells (black line) and PECAM1+GFP+ cells (red line). (F) PECAM1+Thy1.2+ cells, PECAM1+Thy1.2− cells, and VCAM1+ cells were sorted from the lungs of C57BL/6 mice in which iBALT had been induced as described in Fig. 1. Quantitative RT-PCR analysis of Il7 was performed. Three technical replicates were performed for quantitative RT-PCR (A and F). More than three independent experiments were performed with similar results (A–F).

