Fig. 3.
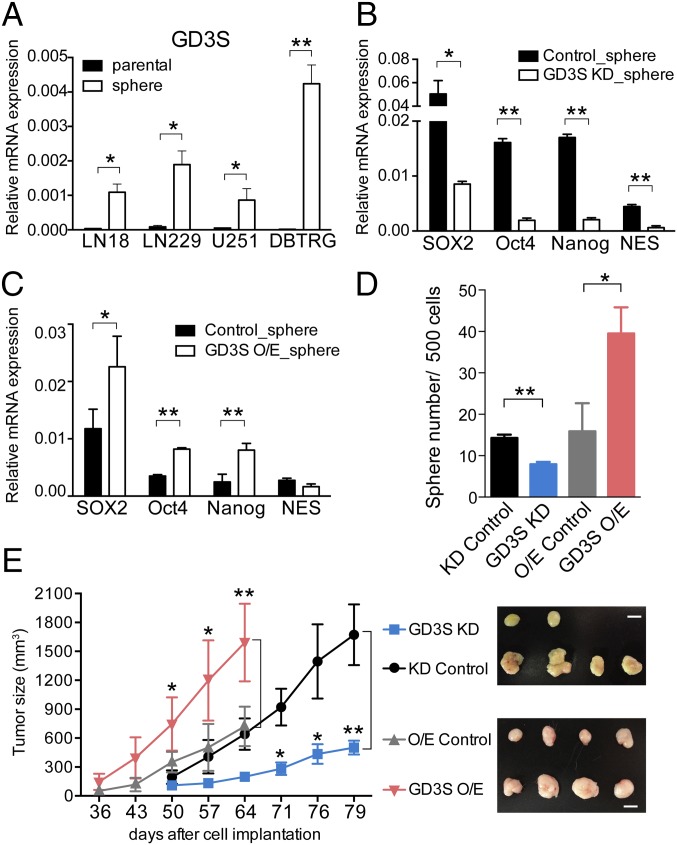
Manipulation of GD3S mediates stemness genes, sphere formation, and tumor initiation. (A) The expression level of GD3S in DBTRG parental cells and neurospheres was measured by Q-PCR. (B and C) The expression levels of stemness genes were determined in neurospheres that expressed vector control, GD3S KD (B), or GD3S O/E (C) plasmid. Results are shown as mean ± SD (n = 3). (D) Neurosphere formation assays using vector control, GD3S KD, or GD3S O/E cells were performed in 96 wells. The mean ± SD for each group (n = 10) is shown. (E) Tumor growth generated from 105 vector control, GD3S KD, or GD3S O/E cells was monitored using a caliper to measure the tumor size every 4 d between 8 and 12 wk (n = 4 mice per group). (Right) Gross view of isolated tumors. (Scale bars, 1 cm.) The P value between groups was determined by an unpaired Student’s t test. *P < 0.05; **P < 0.01.

