Fig. S3.
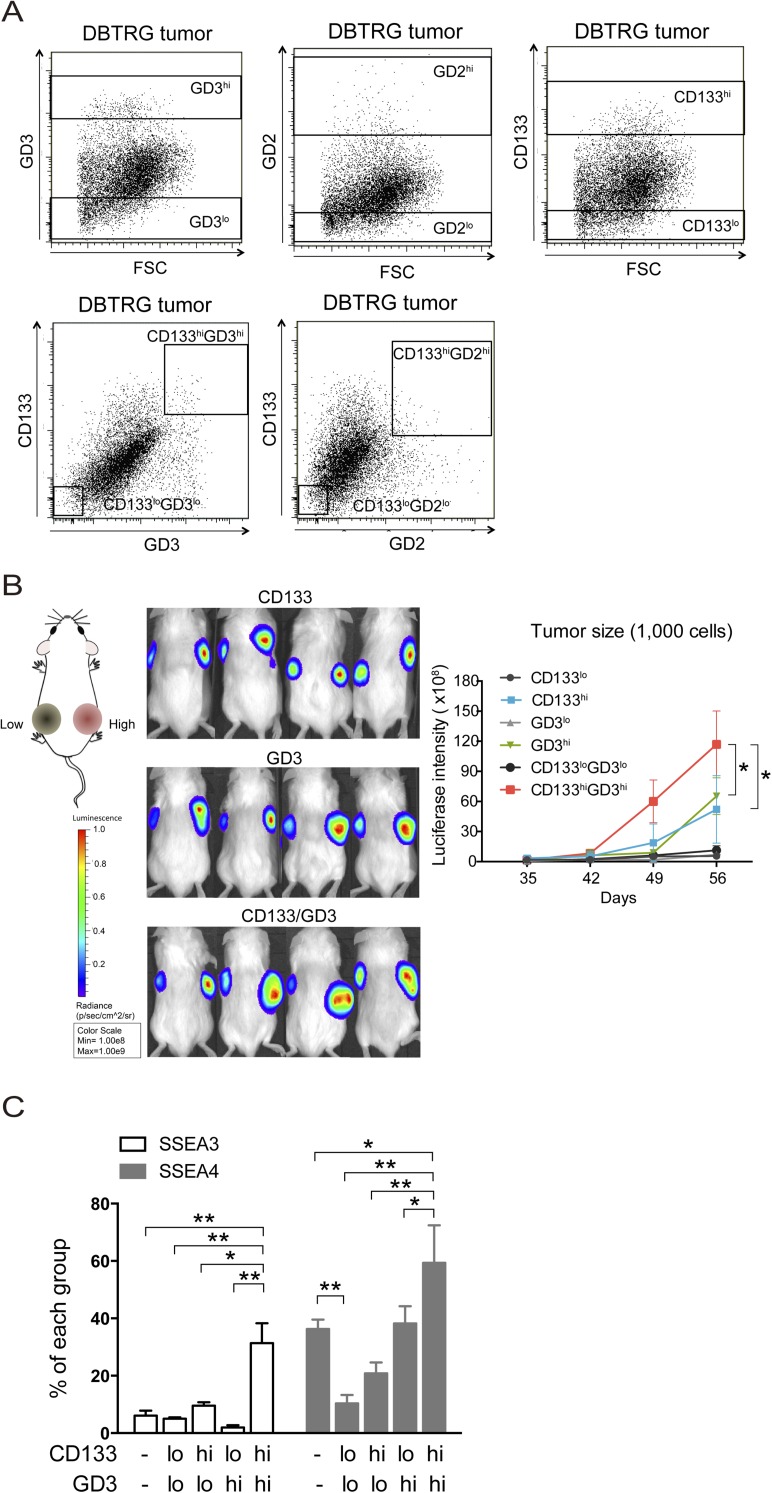
Expression levels of various markers in tumor cells and the tumor growth of 1,000 cells carrying GD3 and CD133 markers. (A) Expression levels of GD3, GD2, and CD133 of DBTRG tumor cells are displayed in a dot blot. The rectangle indicates the sorting area for different molecules. (B) One thousand cells expressing firefly luciferase and the indicated low or high levels of CD133, GD3, and CD133/GD3 were injected into the left or right flanks of nonobese diabetic-scid IL2rγnull mice, respectively, and tumor growth was monitored by bioluminescence imaging (BLI) from 35 to 56 d. (Left) Graphical representation is the BLI intensity for mice injected with the indicated cells at 56 d. Data are the mean ± SD of tumors in four mice. (C) DBTRG tumor cells were costained with anti-SSEA3 (or anti-SSEA4), anti-GD3, and anti-CD133 antibodies. We calculated the percentage of cells expressing SSEA3 or SSEA4 in separated CD133 and GD3 cells. The mean ± SD for each group (n = 3) is shown. All P values between groups were determined by one-way ANOVA. *P < 0.05; **P < 0.01.

