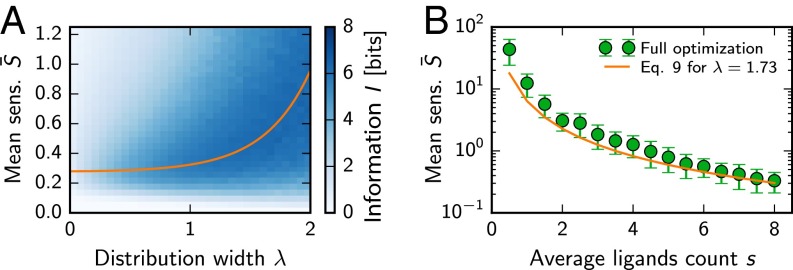
Fig. 3.
Random receptor arrays with a suitable mean sensitivity and distribution width λ can transmit information about both odor concentration and composition. (A) Information I for lognormally distributed sensitivities as a function of the mean and width λ of the distribution. The shown mean of I was calculated from Eqs. 1−3 using Monte Carlo sampling of 32 realizations per point. The orange line marks the optimum given by Eq. 9. (B) Mean sensitivity for different average mixture sizes s. Numerical optimizations over general sensitivity matrices (symbols; mean SD; 64 samples) are compared with lognormally distributed matrices (solid line, Eq. 9) with , equal to the mean of the numerical data. Additional parameters in A and B are the same as in Fig. 1.

