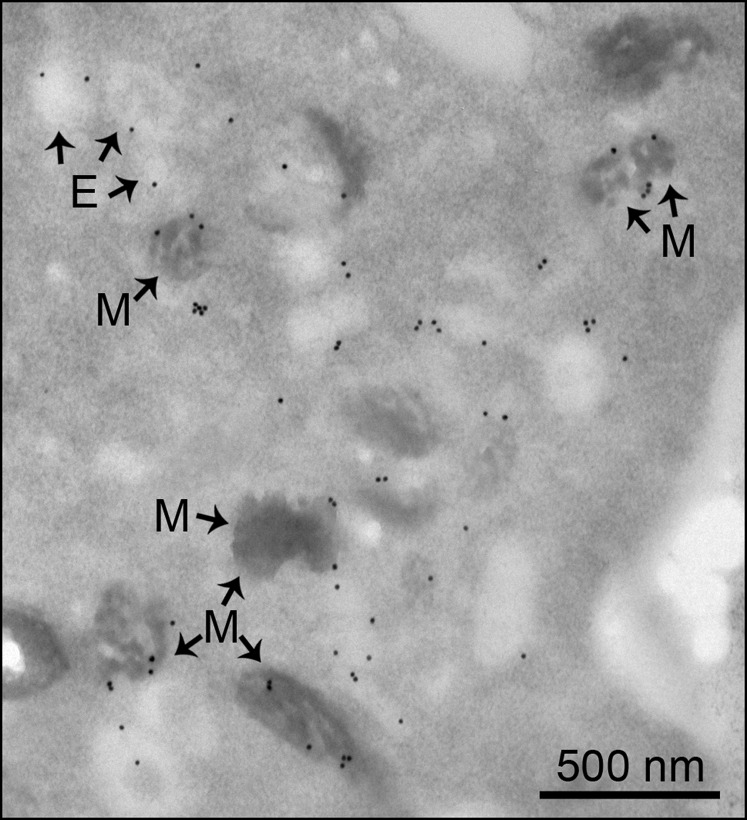
Fig. S3.
Thin-section immunogold electron microscopy analysis of MNT-1 cells overexpressing TPC2-GFP and labeled with an anti-GFP antibody. E, endosome; M, pigmented melanosome. Pigmented melanosomes: 57 ± 9% of label; endosomes/lysosomes: 36 ± 6% of label; nucleus: 2 ± 2% of label; mitochondria: 2 ± 1% of label; 982 gold particles, nine cells. (Scale bar, 500 nm.)

