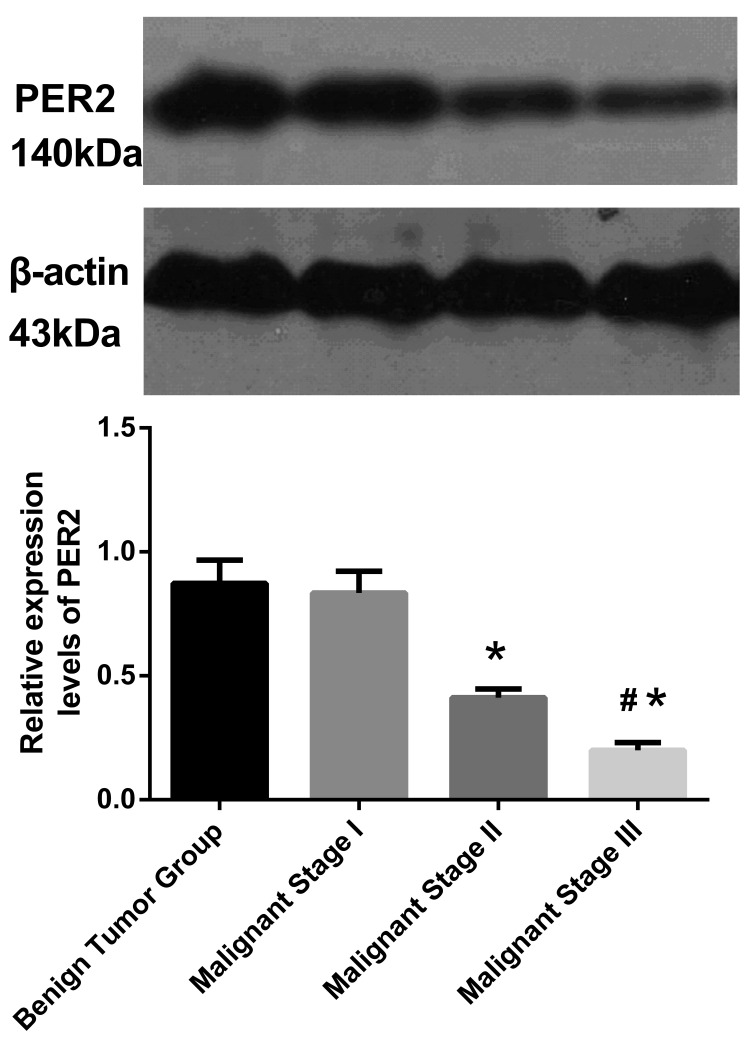
Figure 2.
Protein expression level of Per2 in tumor tissue samples. The single factor variance analyses demonstrate statistically significant differences between the four groups (F=1,785; P<0.001, multiple comparisons). Data are presented as mean ± standard deviation. *P<0.05 vs. benign tumor and malignant stage I; #P<0.05 vs. malignant stage II. Per2, Period2.

