
Figure 1.
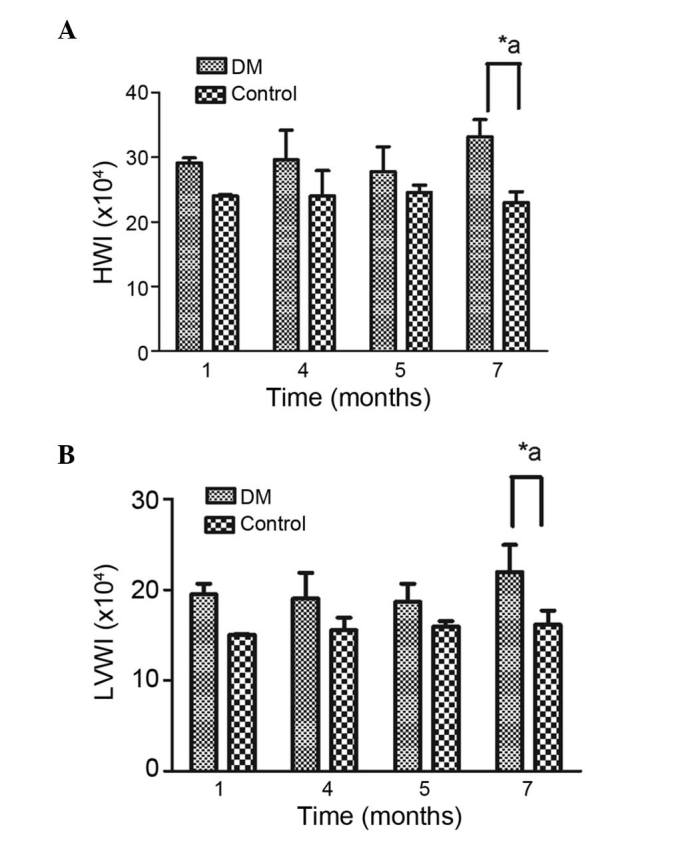
Ratios of (A) heart weight and (B) left ventricle weight to whole body weight. Data are expressed as the mean ± standard deviation. *P<0.05 vs. the DM group at the same time point; aP<0.05, DM group vs. the control group between each month. HWI, heart weight index; LVWI, left ventricle weight index; DM, diabetes mellitus.