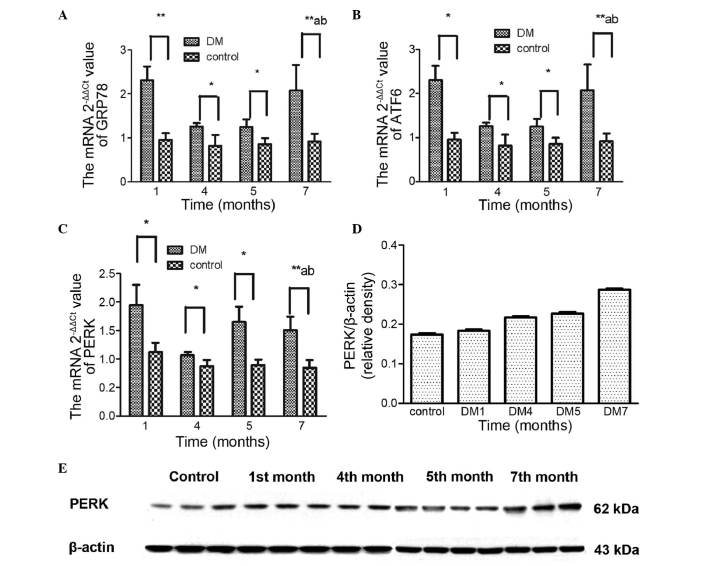
Figure 4.
mRNA and protein expression levels of ER stress markers. The expression levels of (A) GRP78, (B) ATF6 and (C) PERK, and the protein expression levels of (D and E) PERK are shown. Data are expressed as the mean ± standard deviation. *P<0.05 vs. the DM group at the same time point;**P<0.01, DM group vs. the control at 1, 4, 5 and 7 months; aP<0.05, DM group vs. the control group between each month; bP<0.05, 1 month vs. the DM group at 4, 5 and 7 months. DM, diabetes mellitus; ER, endoplasmic reticulum; GRP78, glucose regulating protein 78; ATF6, activating transcription factor 6; PERK, protein kinase R-like ER kinase.

