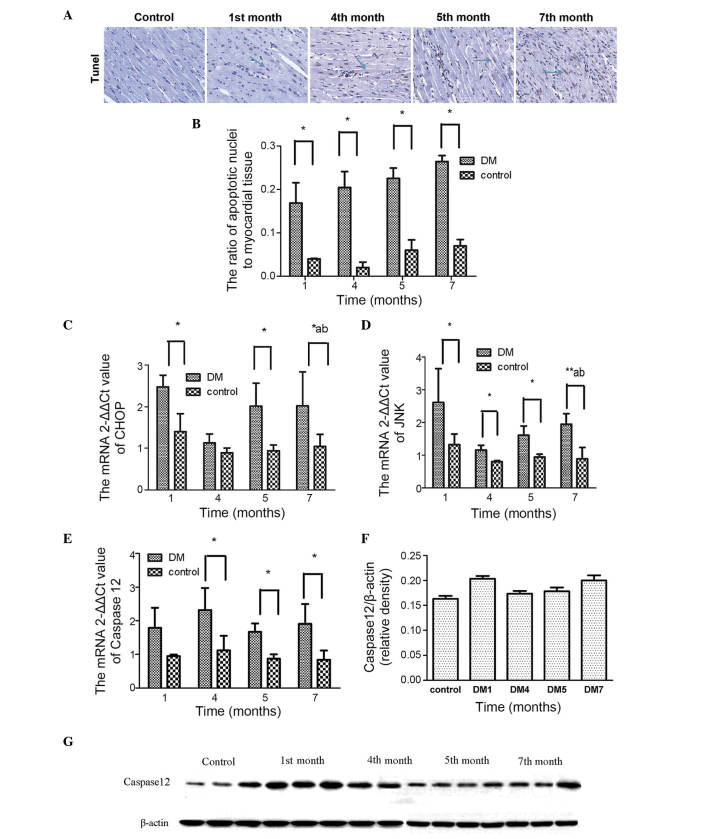
Figure 5.
TUNEL staining of apoptotic nuclei. (A) Nuclei of TUNEL-positive cells were stained brown-yellow (solid arrow) and those of normal cells were stained blue. (B) Ratios of apoptotic nuclei to myocardial tissue. mRNA expression levels of (C) CHOP, (D) JNK and (E) caspase-12 ER stress markers at different time points is shown. (F and G) Protein expression levels of caspase-12. Data are expressed as the mean ± standard deviation. *P<0.05 vs. the DM group at the same time point;**P<0.01, DM group vs. the control at 1, 4, 5 and 7 months; aP<0.05, DM group vs. the control group between each month; bP<0.05, 1 month vs. the DM group at 4, 5 and 7 months. DM, diabetes mellitus; CHOP, C/EBP homologous protein; JNK, Jun N-terminal kinase; TUNEL, terminal deoxynucleotidyl transferase-mediated dUTP-biotin nick end labeling.

