FIGURE 2.
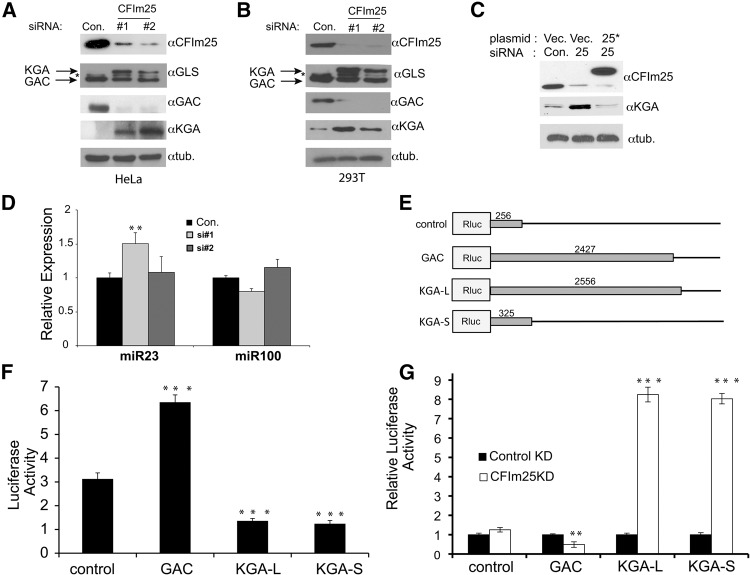
Comparison of GLS isoform expression as it relates to CFIm25 expression. (A) Changes in the protein levels of total GLS and both the GAC and KGA isoforms were determined by Western blotting using isoform specific antibodies in HeLa cells after knockdown of CFIm25 by two different siRNAs (#1 and #2) and compared to control (Con.). (*) Represents a cross-reacting band of unknown identity. (B) Levels of GLS isoform expression in 293T cells were determined by Western blotting after knocking down CFIm25 using two different siRNAs. (C) Lysates were prepared from HeLa cells after cotransfecting RNAi resistant pcDNA6 Flag-CFIm25 (25*) or pcDNA6 Flag-GFP (Vec.) with either the control siRNA (Con.) or CFIm25 si#2 for 48 h, and the levels of CFIm25 and total GLS were determined by Western blotting. Tubulin was used as a loading control. (D) Following CFIm25 depletion by siRNA, qRT-PCR was performed to measure levels of miR23 and miR100, and the results were normalized to SNORD48. Data represented the average ± SD (n = 3) and t-tests were done relative to the control (Con.) samples. (E) Schematic of dual luciferase reporters where different 3′UTRs were cloned downstream from Renilla luciferase. Lengths of inserted 3′UTRs are shown in base pairs. (F) Results of luciferase assays that were normalized to Firefly luciferase expression in lysates from HeLa cells transfected with reporters shown in schematic. All t-tests were done relative to the control plasmid. (G) Results of luciferase assays of lysates transfected with reporters and either control siRNA or CFIm25 siRNA. In each case, individual reporter expression was normalized to control siRNA transfection. The t-test was done for each plasmid between the control and CFIm25 knockdown. The values used were P < 0.01 (**) and P < 0.001 (***).

