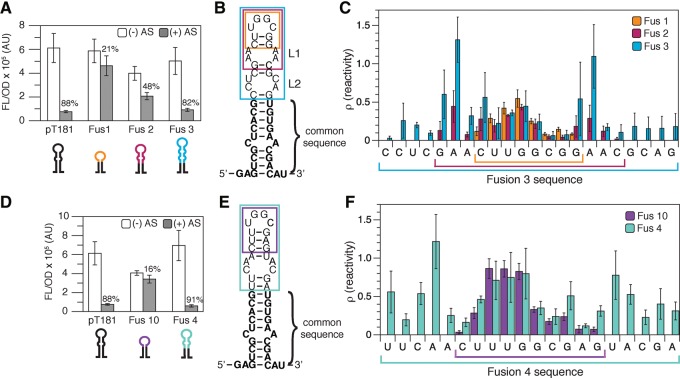
FIGURE 2.
In-cell SHAPE-Seq reveals structural differences between functional and nonfunctional chimeric attenuators. (A) Functional characterization of chimeric fusions between pT181 and interaction sequences from the pMU720 (Siemering et al. 1994) regulator sequence. Average fluorescence (FL/OD) of E. coli TG1 cells with (+ AS) or without (− AS) antisense RNA. Error bars represent standard deviations of nine biological replicates. (B) In-cell SHAPE-restrained secondary structure prediction of the first attenuator hairpin comparing the sequences of Fusions 1–3. Bold nucleotides indicate the common sequence across all fusions originally from the pT181 attenuator. Colored boxes indicate the sequence from the pMU720 regulator included in Fusions 1–3 (cartoons under A). (C) In-cell SHAPE-Seq reactivity comparison for Fusions 1–3 (Fus 1–3). Plot showing a comparison of reactivities for the sequences derived from pMU720 included in Fusions 1–3, indicated by colors as in B. Reactivity spectra represent an average of three independent in-cell SHAPE-Seq experiments with error bars representing standard deviations at each nucleotide. Colored brackets denote the nucleotides included in each fusion. Full reactivity spectra can be found in Supplemental Figure S2. (D–F) As in A–C but for characterization of chimeric fusions between pT181 and interaction sequences from the R1 (Persson et al. 1988) regulator sequence. Full reactivity spectra can be found in Supplemental Figure S4.

