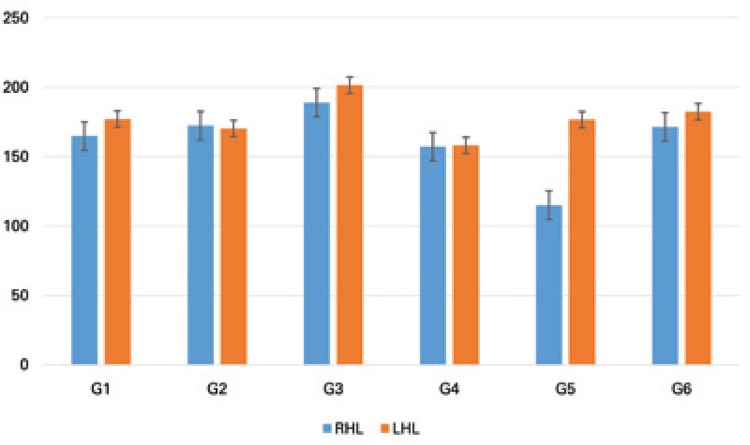
Figure 2. Thickness of the tibial epiphyseal plate e, compared between rats in the different study groups (G1, G2, G3, G4, G5 and G6), and between the right (target) and left (control) hind limbs. The same letter represents similarities and different letters represent significant differences between experimental groups, for the same side.
RHL: right hind limb; LHL: left hind limb.

