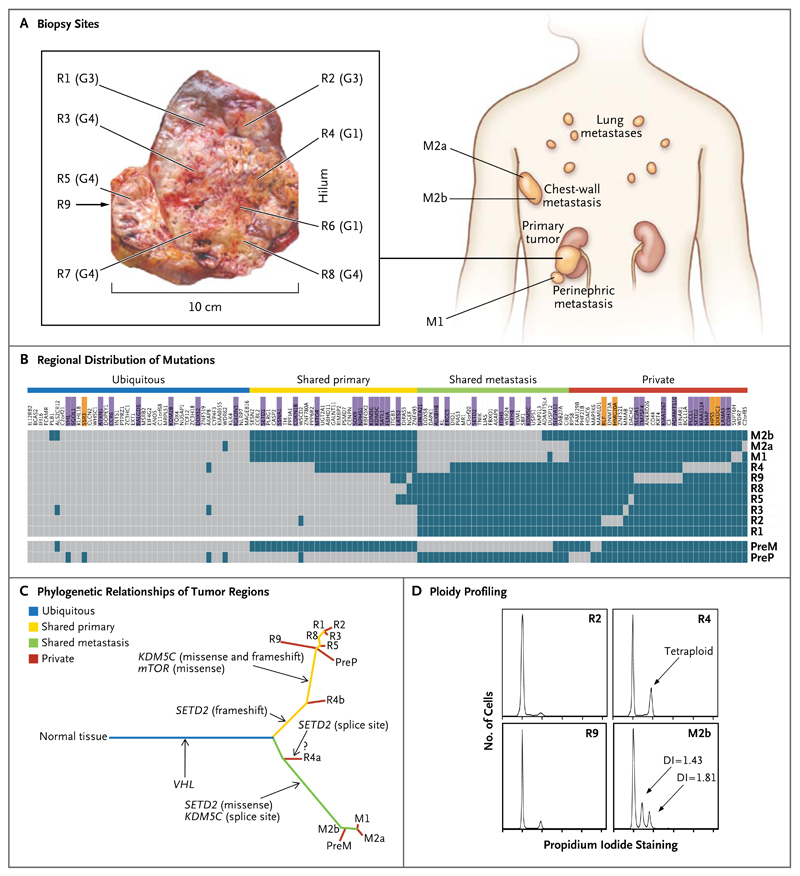
Figure 2. Genetic Intratumor Heterogeneity and Phylogeny in Patient 1.
Panel A shows sites of core biopsies and regions harvested from nephrectomy and metastasectomy specimens. G indicates tumor grade. Panel B shows the regional distribution of 101 nonsynonymous point mutations and 32 indels in seven primary-tumor regions of the nephrectomy specimen (R1 through R5 and R8 through R9), in the perinephric fat of the nephrectomy specimen (M1), and in two regions of the excised chestwall metastasis (M2a and M2b), as detected by exome sequencing (including the VHL mutation detected by Sanger sequencing). Regions R6 and R7 were excluded from analyses since only one nonsynonymous variant passed filtering. The heat map indicates the presence of a mutation (gray) or its absence (dark blue) in each region. The color bars above the heat map indicate classification of mutations according to whether they are ubiquitous, shared by primary-tumor regions, shared by metastatic sites, or unique to the region (private). Among the gene names, purple indicates that the mutation was validated, and orange indicates that the validation of the mutation failed. Because of limited DNA availability, only six mutations were validated in pretreatment samples of the primary tumor (PreP) and chest-wall metastases (PreM) (in VHL, MTOR, SOX9, ALKBH8, SETD2, and KDM5C splice sites). Panel C shows phylogenetic relationships of the tumor regions. R4a and R4b are the subclones detected in R4. A question mark indicates that the detected SETD2 splice-site mutation probably resides in R4a, whereas R4b most likely shares the SETD2 frameshift mutation also found in other primary-tumor regions. Branch lengths are proportional to the number of nonsynonymous mutations separating the branching points. Potential driver mutations were acquired by the indicated genes in the branch (arrows). Panel D shows regional ploidy profiling analysis. All other primary-tumor regions were diploid (not shown). DI denotes DNA index of the aneuploid peak, indicating the DNA content as compared with a diploid genome.

