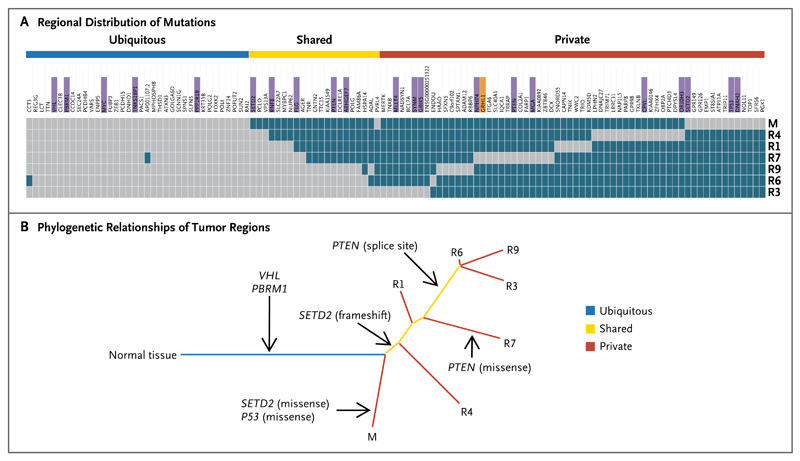
Figure 4. Genetic Intratumor Heterogeneity and Phylogeny in Patient 2.
Panel A shows the regional distribution of somatic mutations detected by exome sequencing in a heat map, with gray indicating the presence of a mutation and dark blue the absence of a mutation. The color bars above the heat map indicate classification of mutations according to whether they are ubiquitous, shared by primary-tumor regions, or unique to the region (private). For gene names, purple indicates that the mutation was validated, and orange indicates that the validation of the mutation failed. Panel B shows phylogenetic relationships of the tumor regions. Branch lengths are proportional to the number of somatic mutations separating the branching points. Potential driver mutations were acquired by the indicated genes in the branch (arrows).

