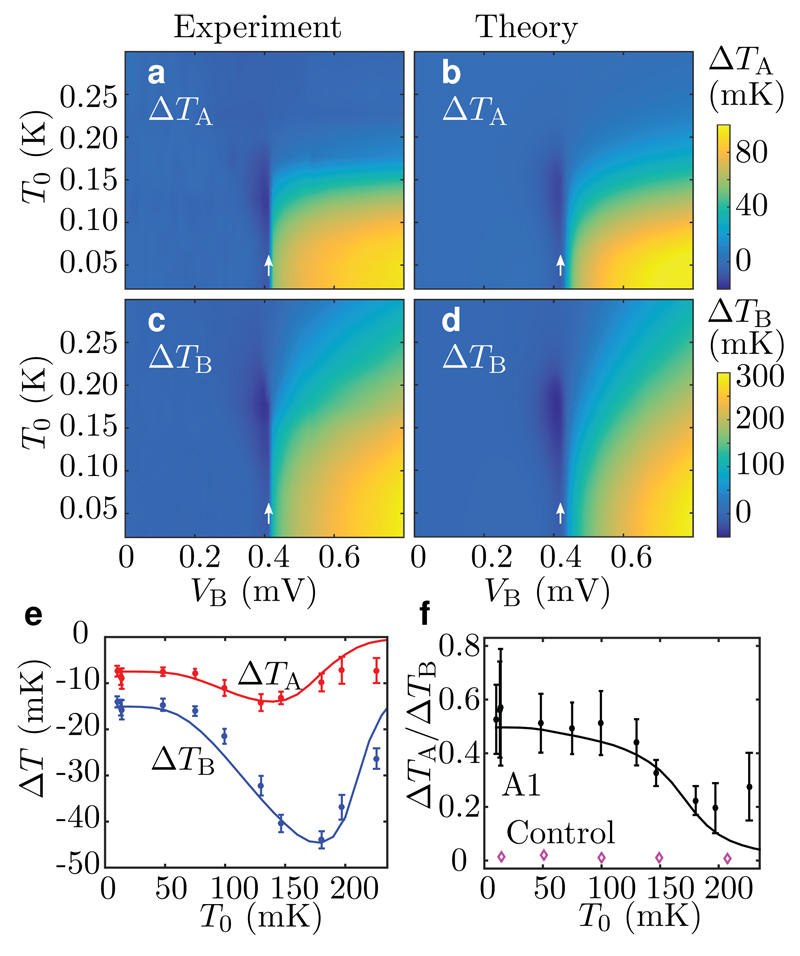
Figure 2. Photonic cooling at macroscopic distances for Sample A1.
a, b, Measured (a) and theoretically predicted (b) electron temperature changes with respect to the zero-bias case (VB = 0) for Island A as functions of the voltage VB and bath temperature T0. At each T0, the maximum cooling is obtained at VB ≈ 0.4 mV ≈ 2Δ/e, as indicated by the white arrows. c, d, As in panels (a, b), but for temperature changes of Island B. e, Measured (markers) and simulated (lines) temperature changes at the maximum cooling point as functions of the bath temperature. The errorbars indicate the standard deviation of the measured temperatures. f, The ratio of the temperature changes in (e). Measurement results from the control sample ( ) are shown for comparison.

