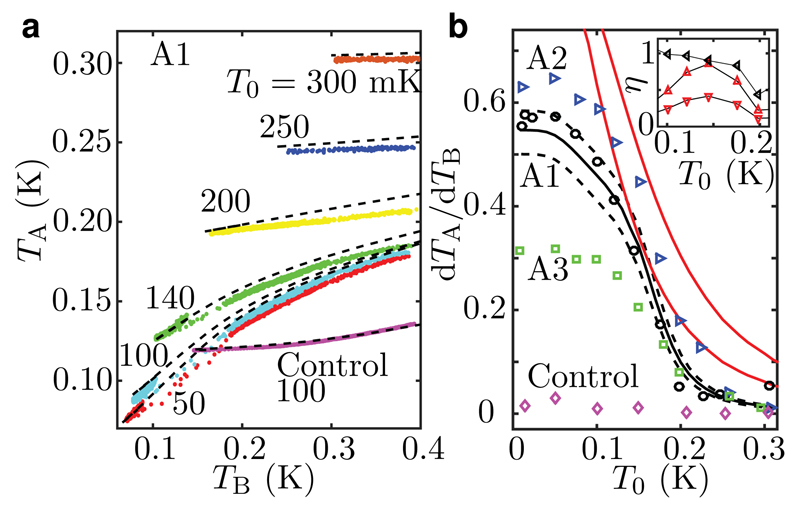
Figure 3. Differential temperature response and the quantum of thermal conductance.
a, Measured (dots) and simulated (dashed lines) temperatures of Island A as functions of the temperature of Island B for the indicated phonon bath temperatures in Sample A1. The results for the control sample at 100-mK bath temperature are shown for comparison. b, Differential temperature response ( ) from (a) at the lowest TB for each bath temperature. The experimental uncertainty is of the order of the marker size. For comparison, we also show the corresponding experimental data for the control sample (
 ), for Sample A2 (
 ), and for A3 (
 ). The solid black line shows the prediction of the full thermal model of Supplementary Fig. 2. The dashed lines are calculated with 80 % (bottom) and 115 % (top) of the quantum of thermal conductance indicating the sensitivity of the results to the photonic heat conduction. The solid red lines are calculated with the simplified thermal model (equation (2)) for Sample A1 with electron–phonon coupling constants7 ΣN↓ = 2 × 10⁹ WK−5m−3 (right), and ΣN↑ = 4 × 10⁹ WK−5m−3 (left). The inset shows the extracted fraction η = GAB/GQ for Sample A1 for the simplified model with ΣN↓ (
 ) and ΣN↑ (
 ) and for the full thermal model (
 ) as functions of T0.

