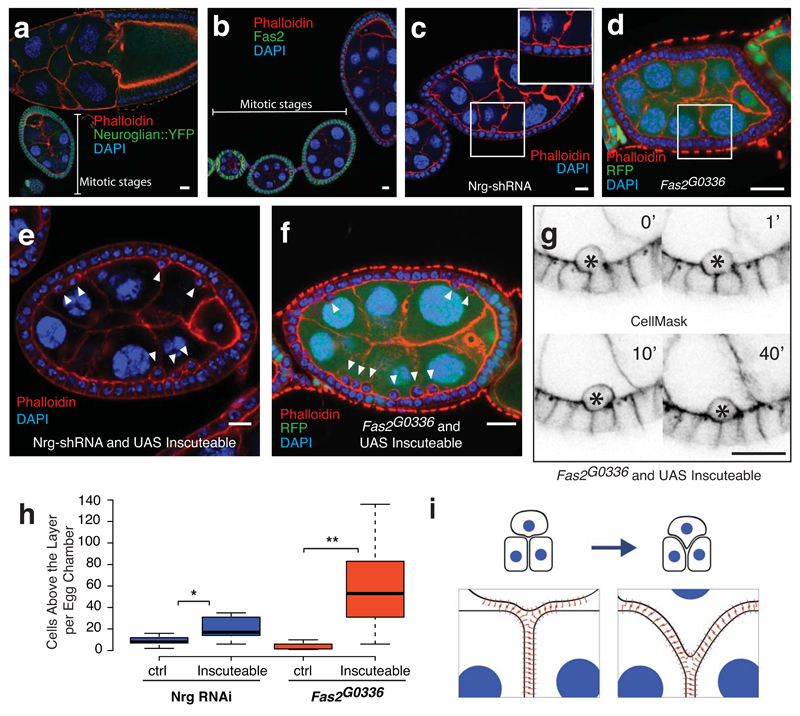
Fig. 5. Reintegration is driven by lateral cell-cell adhesion.
A) Neuroglian expression in follicle cells is higher in mitotic stage egg chambers than in post-mitotic stages. This image is representative of 16.
B) Fas2 expression decreases after mitotic stages. This image is representative of 18.
C and D) Neuroglian knockdown (C) or Fas2 mutation (D) leads to occassional follicle cells that lie apical to the monolayer. These egg chambers, quantified in Figure 5H, represent 1 of 12 (Nrg-shRNA) and 1 of 15 (Fas2 mutant clones).
E and F) Co-expression of Inscuteable with Nrg-RNAi (E) or expression of Inscuteable in Fas2G0336 mutant clones (F) increases the number of follicle cells above the epithelial monolayer. These egg chambers, quantified in Figure 5H, represent 1 of 17 (Nrg-shRNA) and 1 of 10 (Fas2 G0336 clones).
G) Misplaced cells are a consequence of failed reintegrations. A timecourse of 60 minutes shows a cell that fails to reintegrate (marked with an asterisk). This is one of 4 such divisions imaged.
H) Quantification of the frequency of misplaced cells. For Nrg-shRNA, n =12 (control) or 17 (Inscuteable expression) stage 6 egg chambers. p = 0.0091 (*). For Fas2 G0336 clones, n = 15 (control) or 10 (Inscuteable expression) stage 6 egg chambers over 50% RFP negative (Fas2G0336/Fas2G0336). p = 0.0014 (**). Significance was determined using an unpaired, two-tailed students t-test with Welch’s correction. Boxes represent the interquartile range (IQR). Whiskers extend from the lowest point within 1.5 IQR of the lower quartile to the highest point within 1.5 IQR of the upper quartile. The center line is the median.
I) A model illustrating the “zipping-up” of lateral adhesion molecules to drive cell reintegration. Although neighboring cells must unzip, adhesion at the tissue level is increased by the integration of an additional cell.
Scale bars in this figure represent 10μM.

