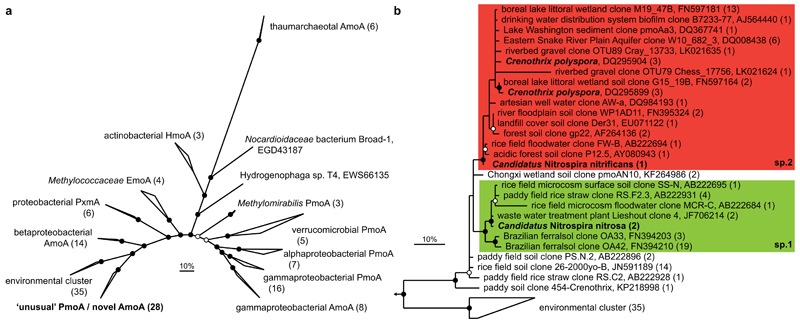
Figure 4. Phylogenetic analysis of the AmoA/PmoA sequence family.
Bayesian interference tree (s.d.=0.01) showing the affiliation of the Nitrospira AmoA. Posterior probabilities ≥70% and ≥90% are indicated by open and filled circles, respectively. Scale bars indicate 10% sequence divergence. a, Radial tree indicating the localisation of the novel AmoA/’unusual’ PmoA sequence group in relation to the main functional groups within the sequence family. Numbers in brackets indicate sequences per group (137 sequences in total). Amo, ammonia monooxygenase; Emo, ethane monooxygenase; Hmo, hydrocarbon/butane monooxygenase; Pmo/Pxm, particulate methane monooxygenase. b, Cladogram detailing the affiliation of the Nitrospira sp.1 (green box) and sp.2 (red box) AmoA sequences within this sequence group. Nitrospira and Crenothrix sequences are depicted in bold. One representative sequence per study is shown for highly similar sequences; numbers in brackets indicate the number of sequences represented.

