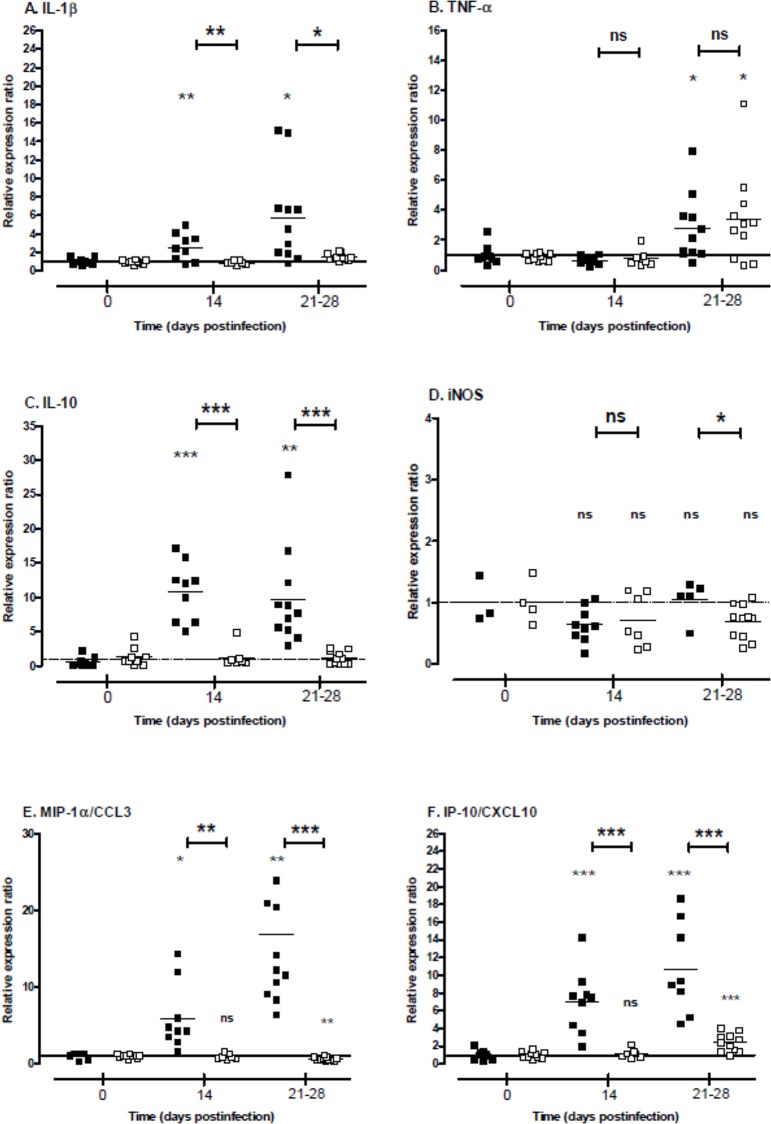
Fig 5. Cytokine, iNOS and chemokine gene expression in the kidneys depending on infected animals during Leptospira carrier state.
Mice (open squares) and hamsters (filled squares) were infected with a sublethal dose of L. borgpetersenii serogroup Ballum isolate B3-13S. Total mRNA was extracted from kidneys at 14 and between 21 and 28 days postinfection and RT-qPCR assays were processed as described in Materials and Methods. Results are expressed as expression ratio relative to non-infected animal controls (time 0). Values are means (horizontal line) and individual ratio (dots). Significant difference in the gene expression levels were evaluated between animals and compared to control individual using an unpaired t-test. *P<0.05, **P<0.005, ***P<0.0005, ns: not significant.

