
Fig 1. Two-way interaction between deviant peer affiliation (low: - 2SD; high: + 2SD) and age2 on total gray matter volume.
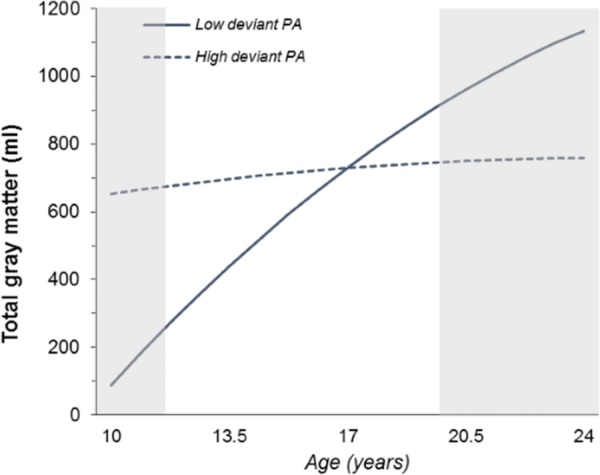
PA = peer affiliation. Regression lines show the predicted values. The shaded areas indicate the regions of significance (RoS), lower threshold: X = 10.44 years; upper threshold: X = 20.16 years.