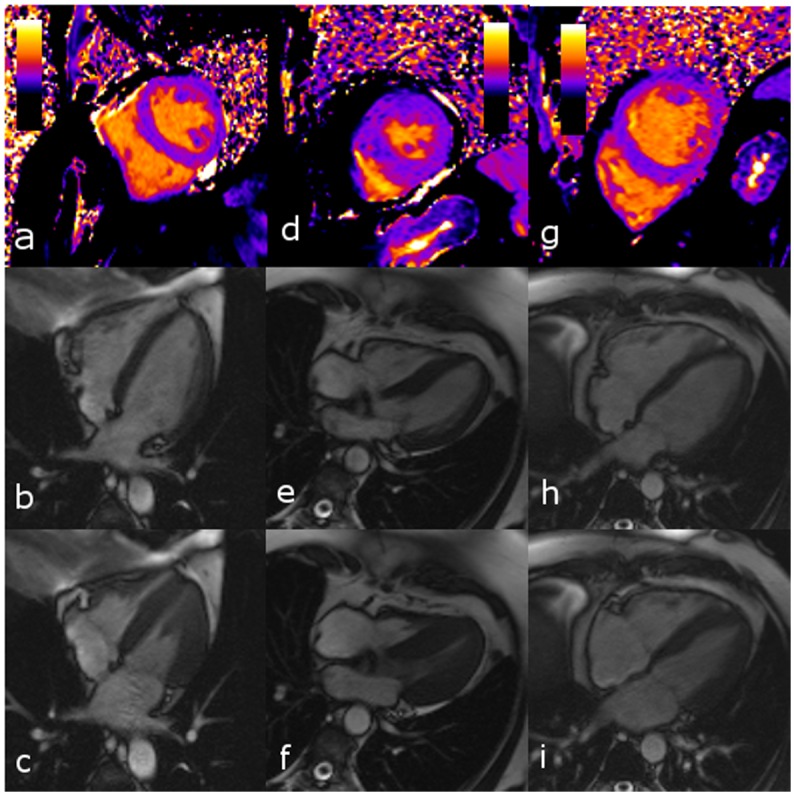
Fig 3. Native T1 maps (a, d, g) and cine 4-chamber images in end-diastole (b, e, h) and in end-systole (c, f, i) in a subject with a healthy heart (a-c), a patient with hypertrophic cardiomyopathy (d-e), and a patient with acute myocarditis (f-i) presenting with nearly identical slice-averaged T1 values.

Native slice-averaged T1 value (T1), end-diastolic volume (EDV), end-systolic volume (ESV), ejection fraction (EF), and thickness of the interventricular septum (IVS) were as following: subject with healthy heart: T1, 968 ms; EDV, 158 ml; ESV, 58 ml; EF, 63%; IVS, 10 mm; patient with hypertrophic cardiomyopathy: T1, 963 ms; EDV, 74 ml; ESV, 17 ml; EF, 77%; IVS, 21 mm; patient with acute myocarditis: T1, 963 ms; EDV, 236 ml; ESV, 103 ml; EF, 56%; IVS, 11 mm. (The T1 scale extends from 0 ms (black) to 2000 ms (yellow).)
