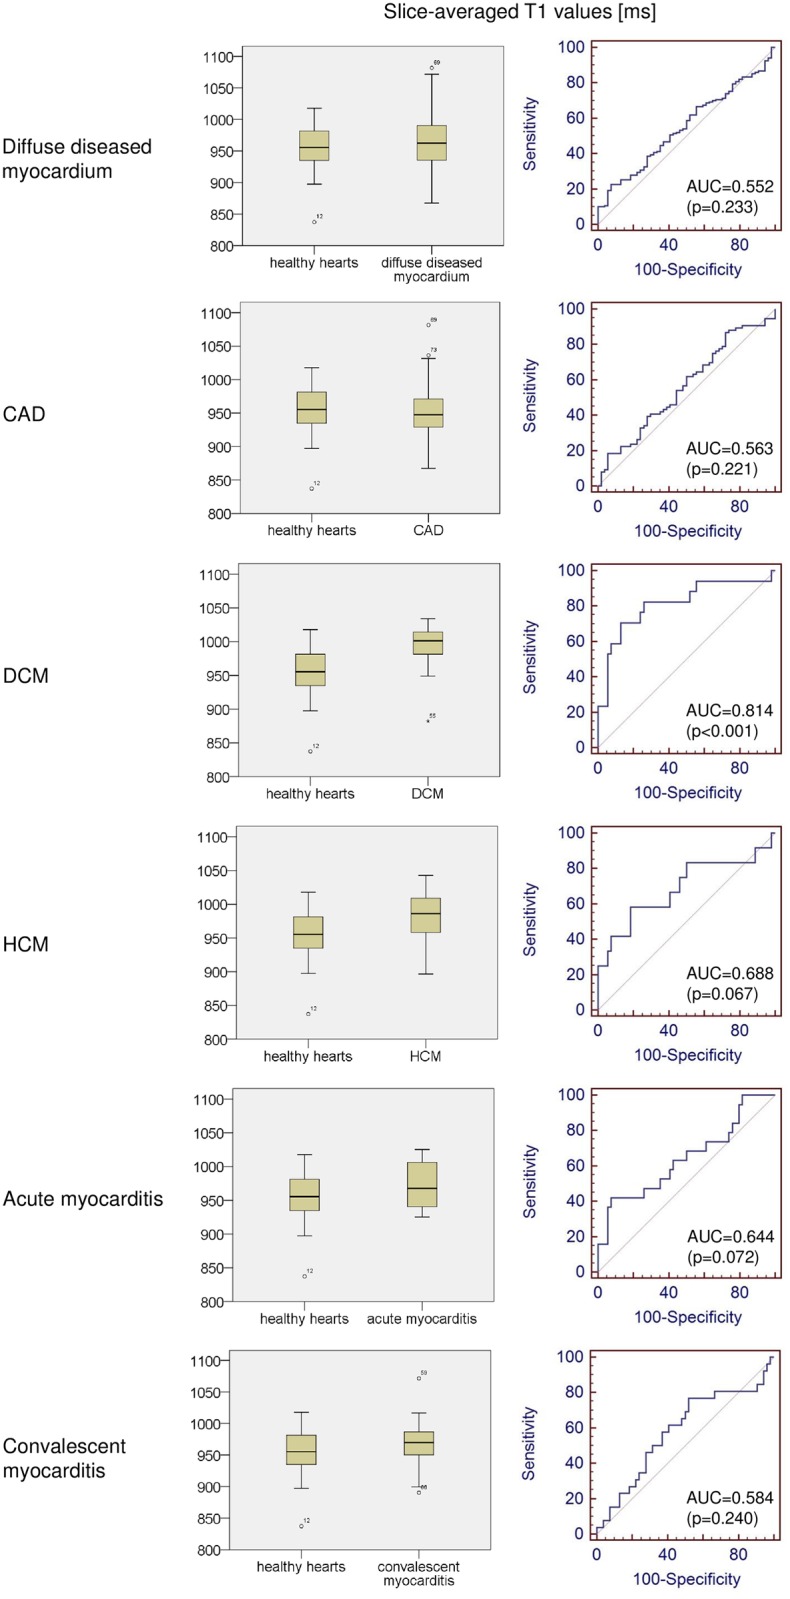
Fig 4. Comparison of native T1 values between healthy hearts and several myocardial pathologies.

Boxplots and receiver operating characteristic curves, comparing slice-averaged native T1 values between subjects with healthy hearts and all patients with diffuse diseased myocardium, followed by individual comparisons between subjects with healthy hearts and patients with distinct cardiac diseases, can be seen. CAD, coronary artery disease; HCM, hypertrophic cardiomyopathy; DCM, dilated cardiomyopathy; AUC, area under the curve.
