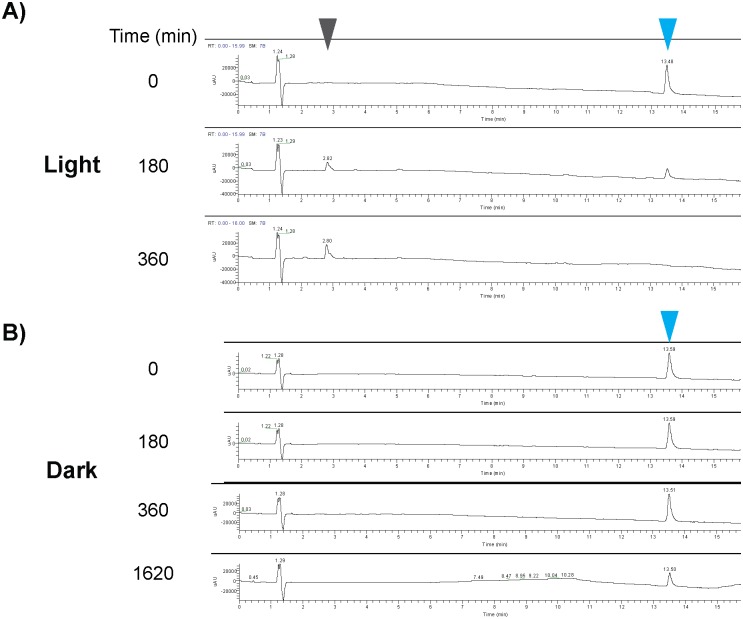
Fig 6. LC-MS analyses of DFPM modification in the presence or absence of light.
DFPM in aqueous solutions gave a distinct absorption peak in non-treated control sample (t = 0) (λmax = 318 nm, blue arrowheads). A) This peak declined after 180 and 360 min DFPM solution incubation in the light. At the same time a second peak was detected which accumulated over time in the light (grey arrowhead). B) If the same solution was incubated in the dark, the DFPM peak continued to decline but more slowly over time (blue arrowheads). No secondary metabolite was detected in the absence of light (B).

