
Figure 1.
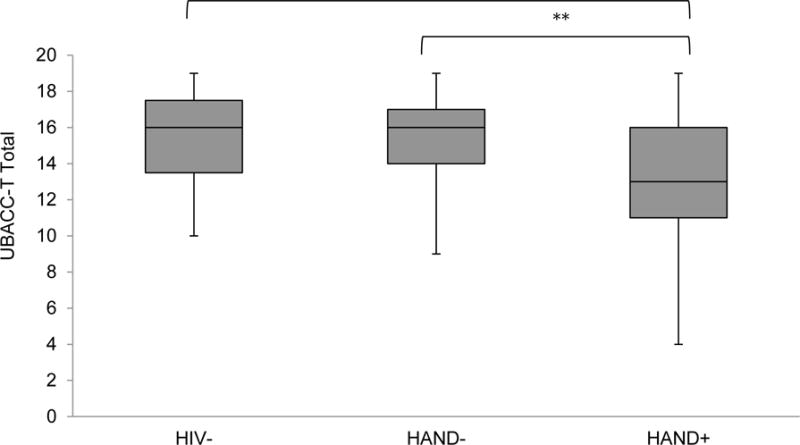
Health-related decision-making comprehension and appraisal across the study samples as measured by the UCSD Brief Assessment for Capacity to Consent to Treatment (UBACC-T total for which lower scores reflect poorer performance). Data are presented as box and whisker plots, with the middle line representing the median, the filled box the middle 50% of each subgroup, and the upper whisker and lower whisker representing, respectively, the upper and lower 25% of each subgroup.
**p< .01; ***p<.001*